17

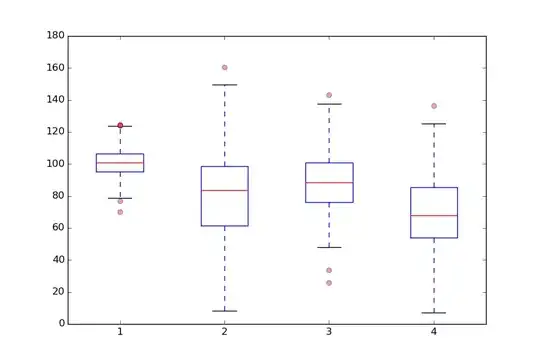
I was wondering if anyone had an issue with Matplotlib's box plot fliers not showing?

I literally copy-pasted this example here into a python script: http://blog.bharatbhole.com/creating-boxplots-with-matplotlib/

...but the box plot fliers (outliers) are not showing. Does anyone know why I might not be seeing them? Sorry if this is a silly question, but I cannot for the life of me figure out why it doesn't work.

## Create data
np.random.seed(10)
collectn_1 = np.random.normal(100, 10, 200)
collectn_2 = np.random.normal(80, 30, 200)
collectn_3 = np.random.normal(90, 20, 200)
collectn_4 = np.random.normal(70, 25, 200)

## combine these different collections into a list    
data_to_plot = [collectn_1, collectn_2, collectn_3, collectn_4]

# Create a figure instance
fig = plt.figure(1, figsize=(9, 6))

# Create an axes instance
ax = fig.add_subplot(111)

# Create the boxplot
bp = ax.boxplot(data_to_plot)

I also tried adding showfliers=True to the last line of that script, but it's still not working.

This is what I get as an output:

enter image description here

Puggie
  • 3,867
  • 2
  • 35
  • 39
maths_student15
  • 171
  • 1
  • 1
  • 3
  • I reproduced the original by copy-pasting that code. Do you have anything else loaded? The grid / background coloring / unit typefaces all seem non-standard. – Tom Mar 06 '15 at 21:37
  • I'm using an iPython notebook... I should've mentioned it. That could be why. Do you know how to put the formatting back to the default Matplotlib settings? – maths_student15 Mar 06 '15 at 21:41

2 Answers2

35

From the look of your plot, it seems you have imported the seaborn module. There is an issue with matplotlib boxplot fliers not showing up when seaborn is imported, even when fliers are explicitly enabled. Your code seem to be working fine when seaborn is not imported:

Boxplot with fliers, no seaborn

When seaborn is imported, you could do the following:

Solution 1:

Assuming you have imported seaborn like this:

import seaborn as sns

you can use the seaborn boxplot function:

sns.boxplot(data_to_plot, ax=ax)

resulting in:

Seaborn boxplot with fliers

Solution 2:

In case you want to keep using the matplotlib boxplot function (from Automatic (whisker-sensitive) ylim in boxplots):

ax.boxplot(data_to_plot, sym='k.')

resulting in:

Matplotlib boxplot with fliers

Community
  • 1
  • 1
Puggie
  • 3,867
  • 2
  • 35
  • 39
2

You might not see fliers if the flier marker was set to None. The page you linked to has a for flier in bp['fliers']: loop, which sets the flier marker style, color and alpha:

import numpy as np
import matplotlib.pyplot as plt

np.random.seed(10)
collectn_1 = np.random.normal(100, 10, 200)
collectn_2 = np.random.normal(80, 30, 200)
collectn_3 = np.random.normal(90, 20, 200)
collectn_4 = np.random.normal(70, 25, 200)

## combine these different collections into a list    
data_to_plot = [collectn_1, collectn_2, collectn_3, collectn_4]

# Create a figure instance
fig = plt.figure(1, figsize=(9, 6))

# Create an axes instance
ax = fig.add_subplot(111)

# Create the boxplot
bp = ax.boxplot(data_to_plot, showfliers=True)

for flier in bp['fliers']:
    flier.set(marker='o', color='#e7298a', alpha=0.5)

plt.show()

yields

enter image description here

unutbu
  • 842,883
  • 184
  • 1,785
  • 1,677
  • Oddly enough, I saw the outliers when I ran the OP's code, but not when running your code. Do you mean to also have `marker=None`? Changing it to `marker='o'` generates your graph (for me). – jedwards Mar 06 '15 at 21:48
  • 1
    @jedwards: Thanks for the heads-up. I copy-pasted the code with the wrong `marker` setting. – unutbu Mar 06 '15 at 21:51
  • Hm. Yeah, I'm not getting a plot like that. I think it's because the iPython notebook I'm using has a weird formatting that I can't get rid of. Is there any easy way to obtain the flier (outlier) values? I've tried looking in `bp['fliers']`, but I can't find a way to extract the values from it. As long as I have the values, I think I can plot them over my box plot. – maths_student15 Mar 06 '15 at 22:08
  • You could get the coordinates from `[line.get_data() for line in bp['fliers']]` but there should be a way to configure IPython or matplotlib/seaborn to display the fliers automatically. – unutbu Mar 06 '15 at 22:13