I'm following the recipe given in this answer by Joe Kington to position a text box in a corner of a plot, using the matplotlib.offsetbox.AnchoredText() module.
This works perfectly if I know where I want to position the text box, but what if I want the box to position itself so that it overlaps the minimum possible fraction of the content plotted in the same figure?
This needs to work as generally as possible, so assume I don't know a priori what the plotted content will be and how it is positioned within the figure.
I've looked at the documentation but there doesn't seem to be a smart option available. Location codes are:
'upper right'  : 1,
'upper left'   : 2,
'lower left'   : 3,
'lower right'  : 4,
'right'        : 5,
'center left'  : 6,
'center right' : 7,
'lower center' : 8,
'upper center' : 9,
'center'       : 10,
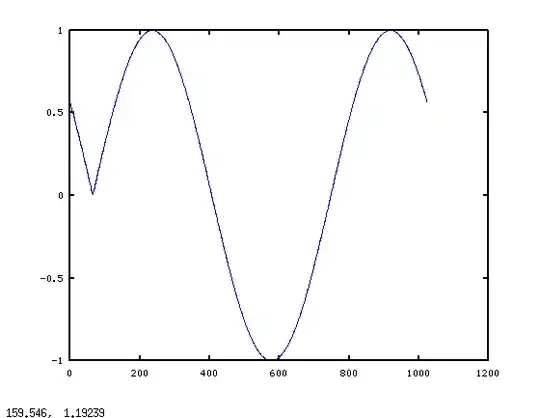
For example, in this case (MWE below):

a better position would be the top (or bottom) left corner, but since I fixed the position manually via loc=1, the text box overlaps the plotted content.
Is there some way to detect where in the figure there is more available empty space and position the box there?
MWE:
import matplotlib.pyplot as plt
import matplotlib.offsetbox as offsetbox

# Define some names and variables to go in the text box.
xn, yn, cod = 'r', 'p', 'abc'
prec = 5
ccl = [546.35642, 6785.35416]
ect = [12.5235, 13.643241]

fig = plt.figure()
ax = fig.add_subplot(111)
ax.axis([0, 5, 0, 1])

import random
pointx = [3. + random.random() for i in xrange(1000)]
pointy = [random.random() for i in xrange(1000)]
plt.scatter(pointx , pointy)

# Generate text to write.
text1 = "${}_{{t}} = {:.{p}f} \pm {:.{p}f}\; {c}$".format(xn, ccl[0],
    ect[0], c=cod, p=prec)
text2 = "${}_{{t}} = {:.{p}f} \pm {:.{p}f}\; {c}$".format(yn, ccl[1],
    ect[1], c=cod, p=prec)
text = text1 + '\n' + text2

ob = offsetbox.AnchoredText(text, loc=1)
ax.add_artist(ob)

plt.show()
