I am tying to find out the best fit for data given. What I did is I loop through various values of n and calculate the residual at each p using the formula ((y_fit - y_actual) / y_actual) x 100. Then I calculate the average of this for each n and then find the minimum residual mean and the corresponding n value and fit using this value. A reproducible code included:
import numpy as np
import matplotlib.pyplot as plt
from scipy import optimize
x = np.array([12.4, 18.2, 20.3, 22.9, 27.7, 35.5, 53.9])
y = np.array([1, 50, 60, 70, 80, 90, 100])
y_residual = np.empty(shape=(1, len(y)))
residual_mean = []
n = np.arange(0.01, 10, 0.01)
def fit(x, a, b):
return a * x + b
for i in range (len(n)):
x_fit = 1 / np.log(x) ** n[i]
y_fit = y
fit_a, fit_b = optimize.curve_fit(fit, x_fit, y_fit)[0]
y_fit = (fit_a * x_fit) + fit_b
y_residual = (abs(y_fit - y) / y) * 100
residual_mean = np.append(residual_mean, np.mean(y_residual[np.isfinite(y_residual)]))
p = n[np.where(residual_mean == residual_mean.min())]
p = p[0]
print p
x_fit = 1 / np.log(x) ** p
y_fit = y
fit_a, fit_b = optimize.curve_fit(fit, x_fit, y_fit)[0]
y_fit = (fit_a * x_fit) + fit_b
y_residual = (abs(y_fit - y) / y) * 100
fig = plt.figure(1, figsize=(5, 5))
fig.clf()
plot = plt.subplot(111)
plot.plot(x, y, linestyle = '', marker='^')
plot.plot(x, y_fit, linestyle = ':')
plot.set_ylabel('y')
plot.set_xlabel('x')
plt.show()
fig_1 = plt.figure(2, figsize=(5, 5))
fig_1.clf()
plot_1 = plt.subplot(111)
plot_1.plot(1 / np.log(x) ** p, y, linestyle = '-')
plot_1.set_xlabel('pow(x, -p)' )
plot_1.set_ylabel('y' )
plt.show()
fig_2 = plt.figure(2, figsize=(5, 5))
fig_2.clf()
plot_2 = plt.subplot(111)
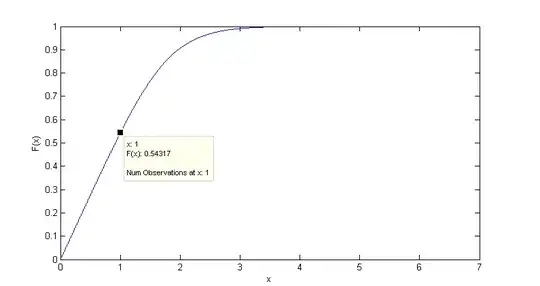
plot_2.plot(n, residual_mean, linestyle = '-')
plot_2.set_xlabel('n' )
plot_2.set_ylabel('Residual mean')
plt.show()
Plotting residual mean with n, this is what I get:
I need to know if this method is correct to determine the best fit. And if it can be done with some other functions in SciPy or any other packages. In essence what I want is to quantitatively know which is the best fit. I already went through Goodness of fit tests in SciPy but it didn't help me much.