2

I have a 3D array of binary data. I want to project this to 3 2D images - side on, head on, birds eye.

I have written the code:

for x in range(data.shape[2]):
    for y in range(data.shape[0]):
        val = 0
        for z in range(data.shape[1]):
            if data[y][z][x] > 0:
                val = 255
                break
        side[y][x] = val

But this is horrifically slow (75s!) for a ~700x300x300 matrix.

What is the fastest way of achieving this task?

EDIT:

To save the image, I have used:

sideImage = Image.fromarray(side)
sideImage.convert('RGB').save("sideImage.png")
user2290362
  • 717
  • 2
  • 7
  • 21

3 Answers3

6

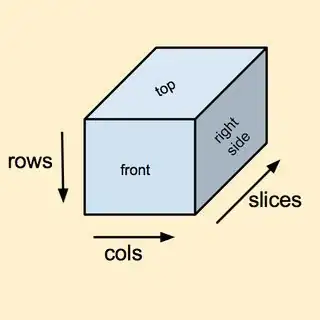
When I have 3D data, I tend to think of it as a 'cube' with rows, columns, and slices - or panels, of 2D images. Each slice or panel is a 2D image that is of dimensions (rows, cols). I usually think of it like this:

3D data cube

with (0,0,0) being in the upper left corner of the front slice. With numpy indexing it is super easy to select just the portions of the 3D array that you are interested in without writing your own loops:

>>> import numpy as np
>>> import matplotlib.pyplot as plt
>>> np.set_printoptions(precision=2)

# Generate a 3D 'cube' of data
>>> data3D = np.random.uniform(0,10, 2*3*5).reshape((2,3,5))
>>> data3D
array([[[ 7.44,  1.14,  2.5 ,  3.3 ,  6.05],
        [ 1.53,  8.91,  1.63,  8.95,  2.46],
        [ 3.57,  3.29,  6.43,  8.81,  6.43]],

       [[ 4.67,  2.67,  5.29,  7.69,  7.59],
        [ 0.26,  2.88,  7.58,  3.27,  4.55],
        [ 5.84,  9.04,  7.16,  9.18,  5.68]]])

# Grab some "views" of the data
>>> front  = data3D[:,:,0]  # all rows and columns, first slice
>>> back   = data3D[:,:,-1] # all rows and cols, last slice
>>> top    = data3D[0,:,:]  # first row, all cols, all slices 
>>> bottom = data3D[-1,:,:] # last row, all cols, all slices
>>> r_side = data3D[:,-1,:] # all rows, last column, all slices
>>> l_side = data3D[:,0,:]  # all rows, first column, all slices

See what the front looks like:

>>> plt.imshow(front, interpolation='none')
>>> plt.show()

front of data cube

tbc
  • 1,679
  • 3
  • 21
  • 28
  • 1
    It's also worth mentioning that with `.sum()` you can quickly look at a true projection (not a slice) of the cube onto any side. `front_proj = data3D[:, :, :].sum(axis=2)` and `top_proj = data3D[:, :, :].sum(axis=0)`, etc. – Curt F. Mar 12 '15 at 23:29
  • Curt, I had to add plt.show() to get the image to open onscreen –  Mar 13 '15 at 20:33
  • @DanPatterson, I just edited my answer to include the `plt.show()`, which is necessary if you are not running IPython in one of the "inline" modes. – tbc Mar 13 '15 at 21:28
1

You can compute it as follows:

>>> data = np.random.random_sample((200, 300, 100)) > 0.5
>>> data.any(axis=-1).shape # show the result has the shape we want
(200, 300)
>>> data.any(axis=-1)
array([[ True,  True,  True, ...,  True,  True,  True],
       [ True,  True,  True, ...,  True,  True,  True],
       [ True,  True,  True, ...,  True,  True,  True],
       ...,
       [ True,  True,  True, ...,  True,  True,  True],
       [ True,  True,  True, ...,  True,  True,  True],
       [ True,  True,  True, ...,  True,  True,  True]], dtype=bool)
>>>

You can scale values if you need

>>> data.any(axis=-1) * 255
array([[255, 255, 255, ..., 255, 255, 255],
       [255, 255, 255, ..., 255, 255, 255],
       [255, 255, 255, ..., 255, 255, 255],
       ...,
       [255, 255, 255, ..., 255, 255, 255],
       [255, 255, 255, ..., 255, 255, 255],
       [255, 255, 255, ..., 255, 255, 255]])
>>>
YXD
  • 31,741
  • 15
  • 75
  • 115
  • That seems to work great, is there a way I can save the image? I have added my old code to the original post – user2290362 Mar 12 '15 at 13:10
  • I recommend [`imsave` from scikit image](http://scipy-lectures.github.io/packages/scikit-image/index.html#input-output-data-types-and-colorspaces) or otherwise `imsave` from `scipy.misc` – YXD Mar 12 '15 at 14:44
1

Some time back I wrote the below as a visualization aid for 3D arrays. Was also a good learning exercise.

# Python 2.7.10
from __future__ import print_function
from numpy import *

def f_Print3dArray(a_Array):
    v_Spacing = (len(str(amax(abs(a_Array)))) + 1) if amin(a_Array)\
        < 0 else (len(str(amax(a_Array))) + 1)
    for i in a_Array[:,:,::-1].transpose(0,2,1):
        for index, j in enumerate(i):
            print(" " * (len(i) - 1 - index) + "/ ", end="")
            for k in j:
                print(str(k).ljust( v_Spacing + 1), end="")
            print("/")
        print()

a_Array = arange(27).reshape(3, 3, 3)
print(a_Array)
print()

f_Print3dArray(a_Array)

Converts this:

[[[ 0  1  2]
  [ 3  4  5]
  [ 6  7  8]]

 [[ 9 10 11]
  [12 13 14]
  [15 16 17]]

 [[18 19 20]
  [21 22 23]
  [24 25 26]]]

To this:

  / 2   5   8   /
 / 1   4   7   /
/ 0   3   6   /

  / 11  14  17  /
 / 10  13  16  /
/ 9   12  15  /

  / 20  23  26  /
 / 19  22  25  /
/ 18  21  24  /

Hope it helps someone.

JayJay123
  • 315
  • 1
  • 5
  • 12