5

For the sample dataset below, I would like to just plot the y as a smooth line with fill under the line using R.

I am able to get smooth line but not the color filled curve. Could someone please help me here?

date, y
2015-03-11, 71.12
2015-03-10, 34.0
2015-03-09, 11.1
2015-03-08, 9.62
2015-03-07, 25.97
2015-03-06, 49.7
2015-03-05, 38.05
2015-03-04, 38.05
2015-03-03, 29.75
2015-03-02, 35.85
2015-03-01, 30.65

The code I used to plot the smooth line is as follows. I am unable to get fill the portion under the line with a color

y <- df$y
x <- 1:length(y)

plot(x, y, type='n')
smooth = smooth.spline(x, y, spar=0.5)
lines(smooth)

enter image description here

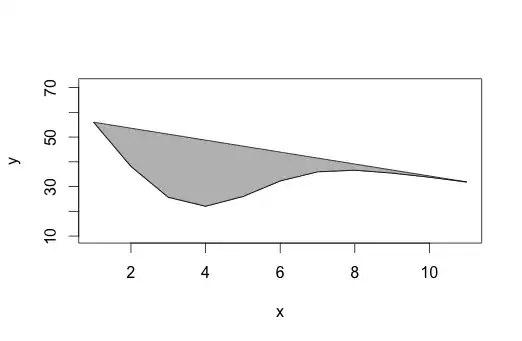
EDIT Using the polygon function does not give what is expected. The shaded area should be below the line not above

with(smooth, polygon(x, y, col="gray"))

enter image description here

CrashOverride
  • 639
  • 1
  • 7
  • 19
  • you want the `polygon` function. software questions are generally considered off-topic here – generic_user Mar 12 '15 at 17:06
  • 1
    Sorry for posting in wrong forum, maybe an admin can move it to right forum? Also I updated with polygon function but it does not give the right output. Please check the edit – CrashOverride Mar 12 '15 at 17:18

1 Answers1

13

Describe a polygon by listing its boundary vertices in order as you march around it.

This polygon's boundary consists of the curve plus two more vertices at the bottom right and bottom left. To help you see them, I have overplotted the vertices, varying their colors by position in the sequence.

Figure

Here is the R code that did it. It used predict to obtain coordinates of the curve from the spline object, then adjoined the x- and y-coordinates of the two extra points using the concatenation operator c. To make the filling go to the axis, the plot range was manually set.

y <- c(71, 34, 11, 9.6, 26, 50, 38, 38, 30, 36, 31)
n <- length(y)
x <- 1:n
s = smooth.spline(x, y, spar=0.5)
xy <- predict(s, seq(min(x), max(x), by=1)) # Some vertices on the curve
m <- length(xy$x)                         
x.poly <- c(xy$x, xy$x[m], xy$x[1])         # Adjoin two x-coordinates
y.poly <- c(xy$y, 0, 0)                     # .. and the corresponding y-coordinates
plot(range(x), c(0, max(y)), type='n', xlab="X", ylab="Y")
polygon(x.poly, y.poly, col=gray(0.95), border=NA)          # Show the polygon fill only
lines(s)
points(x.poly, y.poly, pch=16, col=rainbow(length(x.poly))) # (Optional)
whuber
  • 2,379
  • 14
  • 23
  • 3
    Nicely illustrated. The smooth-object already has the values at the data-x points. Could just pull the `x` and `y` elements from the `s`-object and do this: `polygon(c(s$x[1], s$x, tail(s$x,1)) , c(0, s$y, 0) , col=gray(0.95) )` – IRTFM Mar 12 '15 at 19:00
  • @Bonded Although the spline does have values, they are crude. Normally one will extract a whole lot of vertices along any smooth and use them. To see the difference, replace the `by` parameter in `seq` by a smaller value, such as 0.1 or even 0.01. – whuber Mar 12 '15 at 20:52