Try this code:
import matplotlib.pyplot as pl
import numpy as np

x = np.linspace(1, 10)

def f(x):
    return np.sin(x) + np.random.normal(scale=0.1, size=len(x))

pl.plot(x, f(x))
It will give you a sin wave with some noise added to it:

Edit:
It seems like some kind of random walk is what you're looking for. This function will do that for you:
def f(x):
    y = 0
    result = []
    for _ in x:
        result.append(y)
        y += np.random.normal(scale=1)
    return np.array(result)
This is an example of what it can look like (with x = np.linspace(0, 1000, 1000)):
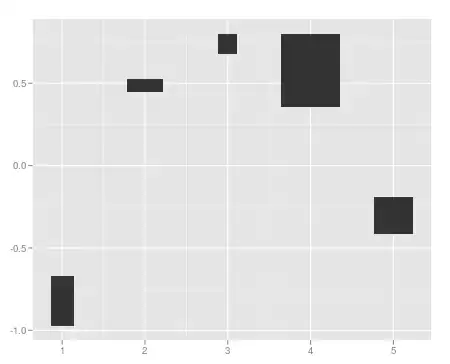
It's not a function of x any longer though, so the code should probably be refactored to generate a random walk with n steps instead. I'll leave that to you :)
Edit 2:
If you want a smoother curve, you can apply a running mean (stolen from this question):
def runningMean(x, N):
    return np.convolve(x, np.ones((N,))/N)[(N-1):]

pl.plot(x, runningMean(f(x), 10))
The bigger window (the N parameter) you use, the smoother the result.
Example: