2

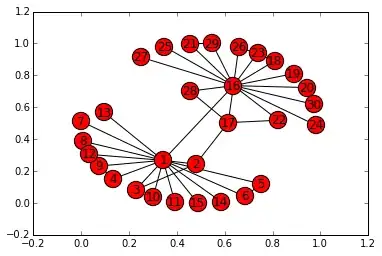
I have a graph network data (using adjacency matrix) of 30 nodes. The graph currently looks like this:

enter image description here

Each cluster has 15 nodes and each node is connected to other node within the same cluster. Only two pair of nodes of different cluster connect with each other. The problem is the graph I am getting is all condensed and each edges within the cluster is not clearly visible. Is there a way I can clearly show each edge within the cluster. Mainly like make the graph bigger with clear edge lines of each node visible.

I plotted this using the following command of networkx lib.

G1=nx.from_numpy_matrix(W1)
nx.draw_networkx(G1)

Where W1 is the adjacency matrix (30x30) of the nodes.

Please advise.

EDIT:

Want something like this with each node clear and edge visible and not condensed. The point is I want the upper cluster points to appear as near that cluster only and same for lower cluster points. But within each cluster, I want the nodes to be a bit separate so that each edge is visible clearly.

enter image description here

EDIT2:

def adjacencyMatrix2():
    for x in range(N):
      if (x<15):
          c=N/2
      else: 
          c=N
      for y in range(x+1,c): 
          W1[x][y]=W1[y][x]=1

# Connecting two other nodes separately. 
W1[0][16]=W1[16][0]=1
W1[1][15]=W1[15][1]=1

adjacencyMatrix2()
G1=nx.from_numpy_matrix(W1)
graph_pos=nx.spring_layout(G1,k=0.50,iterations=50)
nx.draw_networkx(G1,graph_pos)

EDIT3:

N=30
# Creating a matrix of zeros. 
W=np.zeros((N,N))
# Mentioning the edges to start with. Thinking of a pair of 15 node cluster with two cluster connected by two pair of nodes. 
edge=[[1,2],[1,3],[1,4],[1,5],[1,6],[1,7],[1,8],[1,9],[1,10],[1,11],[1,12],[1,13],[1,14],[1,15],
      [16,17],[16,18],[16,19],[16,20],[16,21],[16,22],[16,23],[16,24],[16,25],[16,26],[16,27],[16,28],[16,29],[16,30],
      [1,16],[2,17],[2,3],[5,6],[8,9],[9,4],[18,26],[17,22],[29,21],[17,28]]

# Function for creating adjacency matrix ,populating the zeros matrix with 1 and 0-signifying edges on a node. 

def adjacencyMatrix():
    """This function creates an Adjacency Matrix from a edge set. 
    input-> set of edges to be connected 
    output-> Adjacency matrix (n,n)
    """
    for first,second in edge:
        W[first-1,second-1]=W[second-1][first-1]=1

# Creating the adjacency matrix by calling the function.
adjacencyMatrix()

Also I have seen for each run of the code the layout of the graph changes. I don't want that the graph layout to change with each run of the code. Currently it is doing that.

Baktaawar
  • 7,086
  • 24
  • 81
  • 149

2 Answers2

3

Have you tried applying a node-positioning layout to it? The networkx library has support for layouts. Take a look here. I would personally recommend the spring layout which uses the Fruchterman-Reingold force-directed algorithm. Documentation for that is here. To actually run this in the library, you can try something like:

pos=nx.spring_layout(G1)

where pos is a dictionary of positions keyed by each node.

Edit: You can control the exact spacing of the layout using the parameters referenced in the documentation above. Specifically, something like:

nx.spring_layout(G,k=0.15,iterations=20)
# k controls the distance between the nodes and varies between 0 and 1
# iterations is the number of times simulated annealing is run
# default k =0.1 and iterations=50

Note, I just found these parameters explained from another question on Stack that you can find here: How to increase node spacing for networkx.spring_layout.

Let me know if this helps at all.

Community
  • 1
  • 1
Jason B
  • 7,097
  • 8
  • 38
  • 49
  • Hi Thanks. But it doesn't seem to work. I mean i tried spring_layout, spectral_layout and even others, but it gives me the graph but not very distinct. Most of the nodes are pretty close to each other. I want something where nodes are a bit separate so that each edge can be clearly visible. See above for an ex. – Baktaawar Mar 19 '15 at 04:06
  • Just added some more, let me know if it helps at all. I don't have a sample data set to run this with, so it's hard for me to pre-test it. If you can provide a paste of the Numpy data set in pastebin or another tool, I can try to help find good parameters. – Jason B Mar 19 '15 at 04:12
  • Not much help. The problem is when you tweak the k value it increases the distance between all nodes. What I want is that the graph should appear as cluster of two vertex sets. With each cluster having 15 nodes. But within each cluster the edges should be clear and nodes should have some distance. I have added my code to create adjacent matrix used to create the graph above. – Baktaawar Mar 19 '15 at 04:24
  • If you feel it might not be possible because of so many edges in a cluster, I am adding another code which creates an adjacency matrix where not every node in a cluster has edge with every other node. I tried for that too but still not very clear graphs. See Edit 3 – Baktaawar Mar 19 '15 at 04:26
  • I think the problem is that the nodes are not getting ordered. If the nodes are ordered and that order stays fixed then we can get the edges as I have selected points nodes which are a bit far to see the edge clearly. (Edit 3 code). – Baktaawar Mar 19 '15 at 04:35
0

The thing is that you have very high-density clusters. Then it will be difficult for layout-algorithms to make every edge perfectly clear. Creating a good layout can be difficult.

I would advice you to try Graphviz, which offers really good layout tweaking which might provide the layout you want. You can call Graphviz from Networkx by using networkx.draw_graphviz.

Regarding the randomness of the final layout, it is due to that the initial layout is commonly randomized in layout-algorithms. I don't know if there is a way to seed the randomization in Networkx.

Regarding your third edit with reduced number of edges, I don't see the problem.

import networkx as nx
edges = [[1, 2], [1, 3], [1, 4], [1, 5], [1, 6], [1, 7], [1, 8], [1, 9], [1, 10], [1, 11], [1, 12], [1, 13], [1, 14], [1, 15], [16, 17], [16, 18], [16, 19], [16, 20], [16, 21], [16, 22], [16, 23], [16, 24], [16, 25], [16, 26], [16, 27], [16, 28], [16, 29], [16, 30], [1, 16], [2, 17], [2, 3], [5, 6], [8, 9], [9, 4], [18, 26], [17, 22], [29, 21], [17, 28]]
g = nx.Graph(edges)
nx.draw_networkx(g)

Produces:

Example of graph layout

Which seems distinct and clear according to me.

RickardSjogren
  • 4,070
  • 3
  • 17
  • 26