1

I have non-contiguous date/time data (eg weekend data are missing - I don't have rows in data file for them) and I'd like to not to draw them. Graphically, it would be like cutting out a vertical slice of a plot. I'm aware that the X scale would not be linear and am perfectly happy with this. Here it is what I want to get rid of:

candlestick plot

The gnuplot script is auto-generated so it doesn't have to be very neat if it can't be. Currently I'm doing:

set xdata time
set timefmt "%d/%m/%Y-%H:%M:%S"
unset mx2tics
unset mxtics
set xtics border in scale 1,0.5 nomirror rotate font "Times-Roman,12" "$time_min", $xtics, "$time_max"
set xrange ["$time_minb" : "$time_maxb"]
set grid xtics back

Where obviously $var is a proper value of some variable $var. What I'd like to retain: some small (1-2 candles) margin on the left and on the right (between box border and data), labeled ticks every 10 candles. Ideally all ticks at the borders of time intervals that would be put together in X axis would be marked. Also in the perfect world those labels would be slightly drawn aside to not to overlap each other. But I'm not very picky, I could bear even overlapping of the 2 labels on the joint of 2 intervals if only "empty piece" of a plot is removed.

BTW: I have gnuplot 4.6 but can update to 5.0 if it's necessary.
Martin Evans
  • 45,791
  • 17
  • 81
  • 97
  • I realized the first sentence of the problem description may be misleading: I don't want to draw only the time interval that I have no data in. Just cut out part of X that I have no Y points in. – Marcin Balcerzak Mar 25 '15 at 14:08
  • Are you looking for broken axis? If so, have a look at [this answer](http://stackoverflow.com/a/17683126/2043505) or either [this website](http://gnuplot-surprising.blogspot.com/2011/10/broken-axes-graph-in-gnuplot-3.html) or [this other website](http://www.phyast.pitt.edu/~zov1/gnuplot/html/broken.html). – Schorsch Mar 26 '15 at 14:37

1 Answers1

0

As I understand the question, it is not about breaking the axis. This would also be possible but might get complicated if you have more than one break.

Actually, there are later questions about the similar topic, e.g.: Remove weekend gaps in gnuplot for candlestick chart

The basic idea is to plot the data against the row index (pseudocolumn 0) instead of time (column 1) in order to make discontinuous data "continuous" and "manually" add the xtic labels.

The accepted solution to the above question, however, is using xticlabels and defines a function which shows, e.g. every 5th xticlabel. This looks OK for the illustrated case. However, although, only every Nth ticlabel will be shown, a tic will be created nevertheless at every data entry which will not look good for data with larger time range.

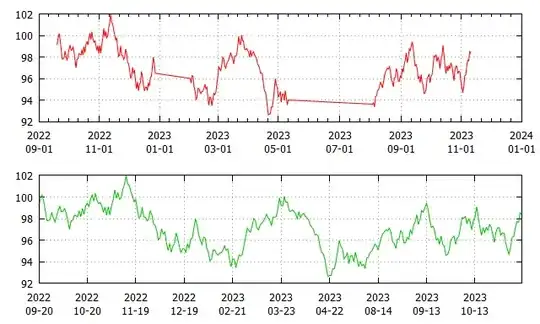
Hence, another approach would be plotting the data twice: first time for the data and the second time plotting NaN, i.e. nothing but the tics, where you can easily select the spacing via every (check help every). Although the data looks continuous, it might useful to indicate the breaks somehow, e.g. with extra tics or vertical lines. Alternatively, depending on the data, each start of a "continuous" subset could be marked with a date label followed by regular minor tics without labels.

Script: (works with gnuplot>=5.2.0, with some adaptions probably with earlier versions).

### plot dis-continuous time "continuous"
reset session

# create some random test data
set table $Data
    myTimeFmt = "%Y-%m-%d"
    t0 = time(0)
    y0 = 100
    f(t) = strftime(myTimeFmt,t1=t0+$0*3600*24)
    plot '+' u (f(0)):(y0=y0+rand(0)*2-1) w table
    t0 = t1 + (rand(0)*30+30)*3600*24
    replot
    t0 = t1 + (rand(0)*50+50)*3600*24
    replot
unset table

set format x "%Y\n%m-%d" timedate
set grid x,y
set ytics 2
set key noautotitle

set multiplot layout 2,1

    plot $Data u (timecolumn(1,myTimeFmt)):2 w l lc "red"
    
    myXTic(col) = strftime("%Y\n%m-%d",timecolumn(col,myTimeFmt))
    N = 30
    plot $Data u 0:2 w l lc "web-green", \
            '' u ($0*N):(NaN):xtic(myXTic(1)) every N
unset multiplot
### end of script

Result:

enter image description here

theozh
  • 22,244
  • 5
  • 28
  • 72