12

I am new to PyQtGraph and need help plotting datetime objects on the x-axis which can easily be done with matplotlib. Any help would be appreciated.

As a simple version of what Id like to do see below where I want to plot the datetime objects displayed as the ticks on the x-axis.

The code throws an error as this cannot be done.

import pyqtgraph as pg
from pyqtgraph.Qt import QtCore, QtGui
import datetime

datetimes = ['2014-10-01 00:00:00', '2014-10-02 00:00:00', '2014-10-03 00:00:00']
x = [datetime.datetime.strptime(i, '%Y-%m-%d %H:%M:%S') for i in datetimes]
y = [1,2,3]


win = pg.GraphicsWindow(title = 'plotting')
p1 = win.addPlot(row=1, col=0, title = 'test')
p1.plot(x,y)

if __name__ == '__main__':
    import sys
    if (sys.flags.interactive != 1) or not hasattr(QtCore, 'PYQT_VERSION'):
        QtGui.QApplication.instance().exec_()
hitzg
  • 12,133
  • 52
  • 54
RicDavimes
  • 345
  • 4
  • 16

3 Answers3

6

pyqtgraph now natively supports DateTime format: https://pyqtgraph.readthedocs.io/en/latest/graphicsItems/dateaxisitem.html?highlight=DateAxisItem

It is quite straightforward, if you have timestamps on the x-axis, just do:

axis = DateAxisItem()
plot.setAxisItems({'bottom':axis})
dumkar
  • 735
  • 1
  • 5
  • 15
4

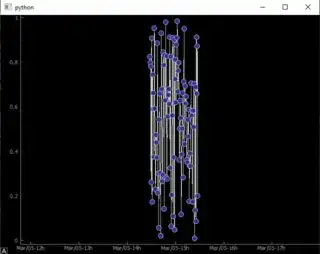
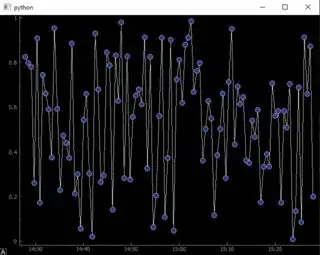
A working example with custom AxisItem on git: pg_time_axis.py.

If using PyQt5, change the import in the __main__ function to from PyQt5 import QtGui

datetime axis zoom 1 datetime axis zoom 2

PS: It would be really nice to see the PR, mentioned by Luke, to be finally merged.

queezz
  • 1,832
  • 2
  • 20
  • 26
2

As you have found, pyqtgraph does not support plotting with datetime objects. You need to convert these to numerical value before plotting.

For static zoom, you can also use AxisItem.setTicks() to customize the text displayed on the axis.

If you want to be able to zoom the axis, then you need to make an AxisItem subclass that overrides tickValues and tickStrings. You can see the docstrings here: https://github.com/pyqtgraph/pyqtgraph/blob/develop/pyqtgraph/graphicsItems/AxisItem.py#L661

..and as an example, there is an open PR that attempts what you are doing here: https://github.com/pyqtgraph/pyqtgraph/pull/74

Luke
  • 11,374
  • 2
  • 48
  • 61
  • 2
    Hi Luke. Do you perhaps have an example of this? I have been able to rename the floats according to datetime but I need it to auto adjust based on the zoom level of the user – RicDavimes Apr 07 '15 at 07:28