I am using ggplot2 in R to plot some data from a csv file. I am particularly interested in seeing the discontinuities in the data. On my line graphs, ggplot leaves gaps in the lines, but I'd like to go even further and highlight the background when these discontinuities occur. Is there a way to do this? I saw this answer(ggplot2: highlight chart area) but I couldn't understand their solution enough to attempt to make it work for me(I'm fairly inexperienced with ggplot).
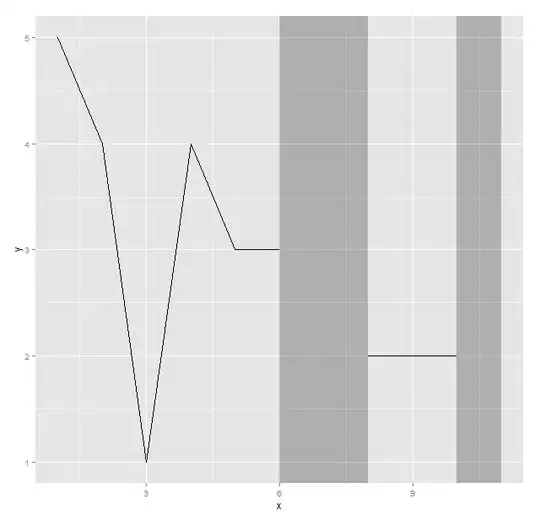
Here's one of the graphs:

Basically I want to highlight the background of those gaps on the right in transparent red.
Here is the code I'm using to generate the graph:
p5 <- ggplot(d2.m, aes_string(x="timestamp",y="value")) +
      geom_line() +
      ylab("Latency (s)") +
      xlab("Time (s)") +
      scale_y_continuous(labels = comma) +
      facet_wrap(~variable, scales="free", ncol=1)

print(p5)