The common misconception of the "box" values is that the first sub-list of the "box" ndarray is always the bottom-left point of the rectangle.
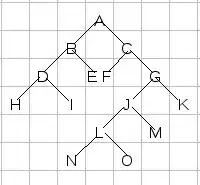
For example, in the rectangle shown below, the first sub-list of "box" ndarray need not represent point A always.

So here is what "box" values represent:
As the question rightly points out, when you print box, you will get a ndarray that looks something like this:
And then I went an extra mile for description and wrote this simple for loop to really understand what "box" values actually represent:
for i in box:
    cv2.circle(image,(i[0],i[1]), 3, (0,255,0), -1)
    imgplot = plt.imshow(image)
    plt.show()
And the results are: (the images are in order)
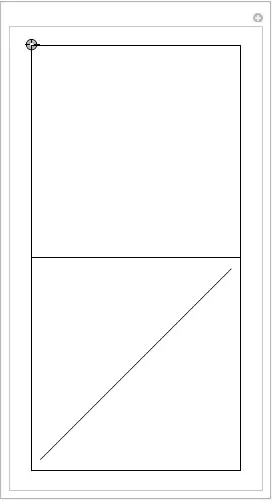
I think the images should have cleared anybody's doubt about "box" values, but here is a summary anyway:
The lowest point of the rectangle(does not matter left or right) will always be the first sub-list of the "box" ndarray. So in the example I have given, the first sub-list [169 144] represents the "bottom right of this rectangle".
Now this point will be the reference point to decide what the next sub-list represents. Meaning, the next sub-list will always represent the point that you first get when you move in the clockwise direction. (as shown in the second image of the for loop)
And keep moving in the clockwise direction to see what the next sub-lists represent.
PS: It is sometimes very hard to read the OpenCV documentation(which is not the best in the world btw) and understand a function and its return values properly. So I suggest churn up little chunks of code, like the for loop and cv2.circle above, to really visualize the return values of a function. That should really clear all your doubts about any functions that you come across in OpenCV. After all, OpenCV is all about "visual"izing!


