I wonder if anyone knows how can I trace back beyond dispatch_async when debugging my iOS program. My program constant crash at two spots: in buffer_is_unused, as shown in 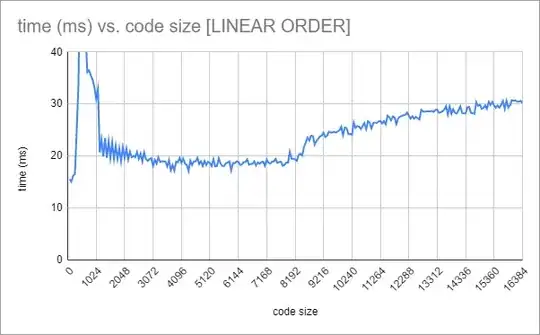 and
and  ,
and in release_shmem_bitmap, as shown in
,
and in release_shmem_bitmap, as shown in  and
and  . None of this happens at the main thread, and on the thread-local stack there is almost nothing except some dispatch_async and pthread jobs. Given my configuration of XCode, it gives me almost no information on who called this dispatched_async. I googled "release_shmem_bitmap" and found only a few webpage on the web and none of them are helpful. I wonder if anyone knows how can I make Xcode to show who called these dispatch_async or in general how shall I fix such crash?
Asked
Active
Viewed 682 times
2
ios learner
- 197
- 1
- 2
- 10
-
Post your stack trace please – Zolnoor Apr 23 '15 at 01:36
-
@Zolnoor aren't the thread views already the stack trace? do you mean the output of po [NSThread callstackSymbols]? – ios learner Apr 24 '15 at 19:07
-
nah bro it looks like this http://imgur.com/Voq04M2 – Zolnoor Apr 24 '15 at 19:13
-
@Zolnoor hi, yeah, I really want to get that kind of stack trace, but how can I get it? I searched "how to get iOS stracktrace" and answers (like http://stackoverflow.com/questions/220159/how-do-you-print-out-a-stack-trace-to-the-console-log-in-cocoa) only said "[NSThread callstackSymbols]" whose output is not very helpful. – ios learner Apr 24 '15 at 19:17
-
Use this to open your console debugger http://stackoverflow.com/questions/25860987/how-can-you-show-the-debugger-console-in-xcode-6 Although it sounds like you're using it if you're typing `po`. You should be letting your program crash to see this trace. There's a chance you have an `all exception` breakpoint that your program is pausing at. – Zolnoor Apr 24 '15 at 19:21
-
As far as I know, there is no stacktrace because EXC_BAD_ACCESS is a SIGSEGV, same as a segfault. You don't get a stacktrace when you segfault in C. – Dennis L Apr 30 '15 at 17:04
1 Answers
0
iOS async stack trace record https://github.com/tiantianbobo/XBAsyncStackTrace
Suppose codes like this when compiled in release version:
- (void)callCrashFunc {
id object = (__bridge id)(void*)1;
[object class];
//    NSLog(@"remove this line will cause tail call optimization");
}
- (void)testDispatchAsyncCrash {
    dispatch_async(dispatch_get_global_queue(0, 0), ^{
        [self callCrashFunc];
    });
}
normal stack trace methods only get you this:
frame #0: 0x000000010186fd85 libobjc.A.dylib`objc_msgSend + 5
    frame #1: 0x0000000104166595 libdispatch.dylib`_dispatch_call_block_and_release + 12
    frame #2: 0x0000000104167602 libdispatch.dylib`_dispatch_client_callout + 8
    frame #3: 0x000000010416a064 libdispatch.dylib`_dispatch_queue_override_invoke + 1028
    frame #4: 0x000000010417800a libdispatch.dylib`_dispatch_root_queue_drain + 351
    frame #5: 0x00000001041789af libdispatch.dylib`_dispatch_worker_thread2 + 130
    frame #6: 0x0000000104553169 libsystem_pthread.dylib`_pthread_wqthread + 1387
    frame #7: 0x0000000104552be9 libsystem_pthread.dylib`start_wqthread + 13
But you still don't know where actual code is.
However, XBAsyncStackTrace will give you:
0   XBAsyncStackTraceExample            0x000000010c89d75c blockRecordAsyncTrace + 76
1   XBAsyncStackTraceExample            0x000000010c89d302 wrap_dispatch_async + 98
2   XBAsyncStackTraceExample            0x000000010c89c02c -[ViewController testDispatchAsyncCrash] + 92
3   XBAsyncStackTraceExample            0x000000010c89be3d -[ViewController viewDidLoad] + 269
4   UIKitCore                           0x0000000110ae44e1 -[UIViewController loadViewIfRequired] + 1186
5   UIKitCore                           0x0000000110ae4940 -[UIViewController view] + 27
Bingo!
Xiaobo Chen
- 1
- 1