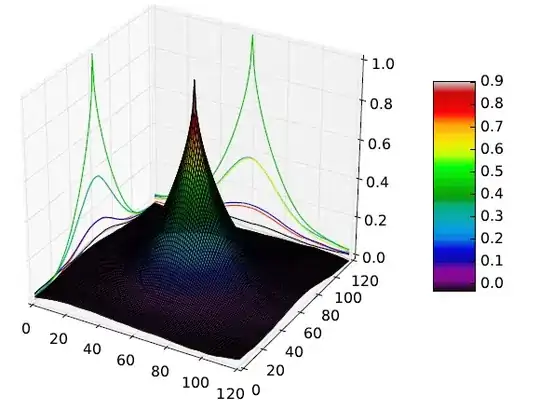
I have the following code to display a 3D surface using ax.plot_surface:
fig = plt.figure()
ax = fig.gca(projection='3d')
X,Y = np.meshgrid(range(k_mean.shape[0]), range(k_mean.shape[1]))
Z = k_mean
surf = ax.plot_surface(X, Y, Z, rstride=1, cstride=1, linewidth=0., alpha=0.8, cmap=cm.nipy_spectral, antialiased=False, shade=False)
cset = ax.contour(X, Y, Z, zdir='z', offset=0, cmap=cm.nipy_spectral)
cset = ax.contour(X, Y, Z, zdir='x', offset=0, cmap=cm.nipy_spectral)
cset = ax.contour(X, Y, Z, zdir='y', offset=120, cmap=cm.nipy_spectral)
ax.set_xlim(0, 120)
ax.set_ylim(0, 120)
ax.set_zlim(0, 1)
fig.colorbar(surf, shrink=0.5, aspect=5)
plt.show()
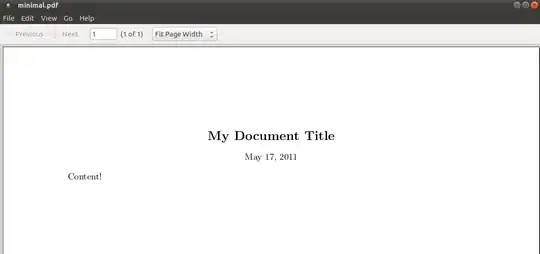
plt.savefig('3d.pdf', dpi=500)
The display of the plot in Spyder is "correct", but the PDF seems to ignore the linewidth=0.. How can I fix that?
Spyder output:

PDF output: