This is quite a tough challenge I have with my code. First of all the code I am putting here is not runnable because I am using an Excel sheet (but I am happy to email it if people want to try using my code).
What I have is an Excel sheet with data on cross-sectional fibres in a microscopic image I took. The information is basically: location of the section, area, angle of rotation.
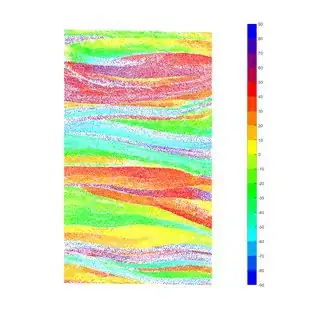
From that I calculate the angle of orientation Phi, and Gamma. After that I use the scatter function to plot a dot of different colors for each Phi angle value. I use a constant color for a range of 10 degrees. Which gives me a picture like this:
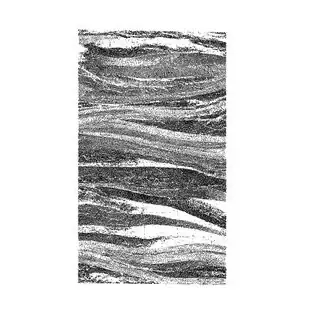
Now my aim to is calculate the area of each homogeneous region. So I look for a way to plot let's say all the dots within the -10 +10 region (I'm doing 20 degrees for now, but will do 10 after). I used a look and I get a picture like this:
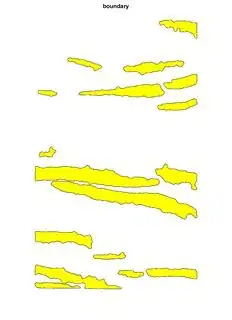
The white corresponds where the dots are within the range I selected. After that I use the toolbox in MATLAB to convert each dot into a pixel. So I'll get a black background with loads of white pixels, then I use imdilate to make circles, fill holes and isolate each region with a specific color. Finally I use the functions boundary and patch, to create each boundary and fill them with a color. And I get a picture like this:
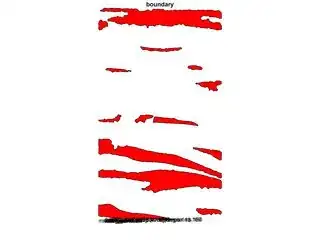
Which is what I want and I can get the area of each region and the total area (I used a threshold to discard the small areas). Then I run the code several time for each region, and I use imfuse to put them back together and see what it looks like.
THE PROBLEM is, they overlap quite a lot, and that is because there are some errors in my data, and therefore some blue dots will be in the red and so on. So I want to run the code once, then when I rerun it with another range, it does the same thing but doesn't take into account value when there's already something plotted before.
I tried to do that by, after running once, saving the matrix bw4 and adding a condition when plotting the black and white pic, by saying if Phi is in my range AND there no white here then you can put white, otherwise it's black. But it doesn't seem to work.
I understand this is quite a complicated thing to explain, but I would appreciate any ideas, and open to chat via email or otherwise. I am putting the full code now, and I can send you my Excel sheet if you want to run it on your computer and see for yourself.
clearvars -except data colheaders bw4
close all
clc
%%
%%%%%%%%%%%%%%%%%%%%%%%%%%%%%%%%%%%
%%% CHANGE DATA FOR EACH SAMPLE %%%
%%%%%%%%%%%%%%%%%%%%%%%%%%%%%%%%%%%
cd 'C:\Users\dkarta\Desktop\Sample 12\12.6'
data=xlsread('Sample12_6res.xlsx');
cd 'C:\Users\dkarta\Documents\MATLAB'
%data=Sample121res; % Data name
imax=length(data); % Numbers of rows in data sheet
y=11900; % Number of pixels in the y on image j
%%
data(:,15)=data(:,9)*pi/180; % Convers Column 9 (angle of rotation) in rads
data(:,16)=y-data(:,6); % Reset the Y coordinate axis to bottom left
delta = 0 : 0.01 : 2*pi; % Angle in paramteric equations
theta=45*pi/180; % Sample cutting angle in rads
%AA=[data(:,5)' data(:,16)' phi']
% Define colors
beta=acos(data(1:imax,8)./data(1:imax,7));%./acos(0);
phi=atan(sin(beta).*cos(data(1:imax,15))./(sin(theta)*sin(beta).*sin(data(1:imax,15))+cos(theta)*cos(beta)))/(pi/2);
phi2=phi/2+1/2; % Scales in plane angle phi between 0 and 1
gamma=atan((cos(theta)*sin(beta).*sin(data(1:imax,15))-sin(theta)*cos(beta))./...
(sin(theta)*sin(beta).*sin(data(1:imax,15))+cos(theta)*cos(beta)))/(pi/2);
gamma2=gamma+1/2; % Scales out of plane angle gamma between 0 and 1
%%
%%%%%%%%%%%%%%%%%%%%%%%%%%%
%%% MESHGRID AND COLOURMAP %%%
%%%%%%%%%%%%%%%%%%%%%%%%%%%
x1=data(1:imax,5);
y1=data(1:imax,16);
z1=phi*90;
z2=gamma*90;
n=300;
%Create regular grid across data space
[X,Y] = meshgrid(linspace(min(x1),max(x1),n), linspace(min(y1),max(y1),n));
% Creating a colormap with 10 degree constant colors
map4=[0 0 1;0 1/3 1;0 2/3 1; 0 1 1;0 1 2/3;0 1 1/3;0 1 0;1/3 1 0;2/3 1 0;1 1 0;1 0.75 0;1 0.5 0;1 0.25 0;1 0 0;0.75 0 0.25;0.5 0 0.5;0.25 0 0.75; 0 0 1];
Colormap4=colormap(map4);
h=colorbar;
caxis([-90 90])
set(h, 'YTick', [-90:10:90])
%%
%%%%%%%%%%%%%%%%%%%%%%%%%%%%%%%%%%%%%%%%%%%%%%%%%
%%% PLOT USING SCATTER - ISOLATE SOME REGIONS %%%
%%%%%%%%%%%%%%%%%%%%%%%%%%%%%%%%%%%%%%%%%%%%%%%%%
a=-10; % Lower boundary for angle interval
b=10; % Upper boundary for angle interval
c=z1>a & z1 < b;
c=c.*1;
%j=1;
y1=(y1-min(y1)+1);
y2=max(y1)-y1+1;
[X1,Y1]=meshgrid(1:500,1:500);
griddata(x1,y2,c,X1,Y1);
clear c1
for i=1:imax
if z1(i)< b && z1(i)> a %&& bw4(round(y1(i)),round(x1(i))) == 0
c(i) = 1;
c1(round(y2(i)),round(x1(i)))=1;
else
c(i)= 0;
c1(round(y2(i)),round(x1(i)))=0;
end
end
C=[c c c];
%c(find(c==0)) = NaN;
%contourf(X,Y,griddata(x1,y1,c,X,Y),100,'EdgeColor', 'None')
figure(1), scatter(x1,y1,3,z1,'filled');
axis equal
axis ([0 8000 0 12000])
axis off
figure(2), scatter(x1,y1,3,C,'filled');
axis equal
axis ([0 8000 0 12000])
axis off
se=strel('disk',50,8);
bw2=imdilate(c1,se);
bw4=bwlabel(bw2);
bw3=imfill(bw4,'holes');
max(bw4(:));
figure(3),imshow(c1,'InitialMagnification', 10);
figure(4), imshow(bw2,'InitialMagnification', 10);
figure(5), imshow(bw3,'InitialMagnification', 10);
figure(6),imshow(label2rgb(bw4),'InitialMagnification', 10);
k=ones(max(bw4(:)),1);
clear bw5
for i=1:length(x1)
if bw3(round(y2(i)),round(x1(i))) ~= 0
m=bw3(round(y2(i)),round(x1(i)));
bw5{m}(k(m),1)=x1(i); bw5{m}(k(m),2)=y2(i);
k(m)=k(m)+1;
end
end
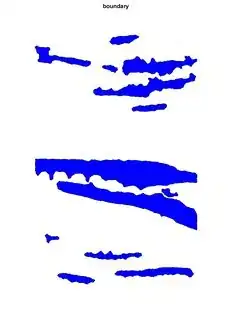
figure(7), imshow(~c1,'InitialMagnification', 10);
hold on
for i=1:max(bw4(:))
%scatter(bw5{i}(:,1),bw5{i}(:,2))
j = boundary(bw5{i}(:,1),bw5{i}(:,2),0.5);
%poly=convhull(bw5{i}(:,1),bw5{i}(:,2));
%plot(bw5{i}(poly,1),bw5{i}(poly,2)), title('convhull')
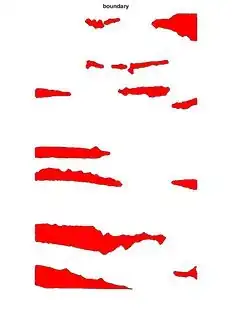
if polyarea(bw5{i}(j,1),bw5{i}(j,2))> 10^5;
patch(bw5{i}(j,1),bw5{i}(j,2),'r'), title('boundary')
indexminy(i)=find(min(bw5{i}(:,2)) == bw5{i}(:,2));
indexminx(i)=find(min(bw5{i}(:,1)) == bw5{i}(:,1));
indexmaxy(i)=find(max(bw5{i}(:,2)) == bw5{i}(:,2));
indexmaxx(i)=find(max(bw5{i}(:,1)) == bw5{i}(:,1));
%xmin = bw5{i}(indexminx); xmax = bw5{i}(indexmaxx);
%ymin = bw5{i}(indexminy); ymax = bw5{i}(indexmaxy);
str=[(indexminx(i)+indexmaxx(i))/2,(indexminy(i)+indexmaxy(i))/2,'Region no.',num2str(i)];
text((min(x1(i))+max(x1(i)))/2,(min(y1(i))+max(y1(i)))/2,str)
polya(i)=polyarea(bw5{i}(j,1),bw5{i}(j,2));
end
end
spolya=sum(polya(:))
print -dpng -r500 B
Just to show you more pictures of when I fuse several of them:
 And when I fuse:
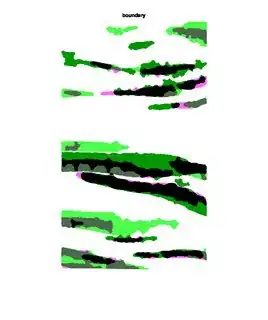
As you can see they overlap, which I don't want, so I want each image that I create to 'know' what I'm doing on the previous runs so that it doesn't overlap. I want to get the percentage area of each region and if they overlap I cannot use the actual total area of my sample and the results are wrong.