TikZ can do this.
A quick demo:
\documentclass{article}
\usepackage{tikz}
\begin{document}
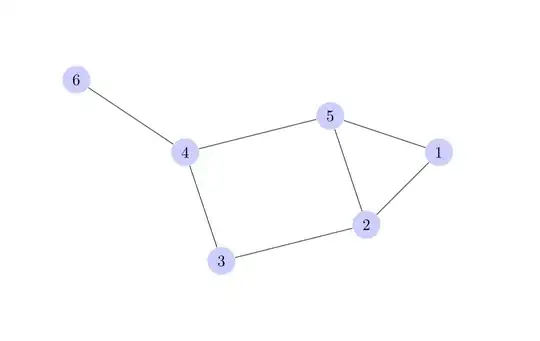
\begin{tikzpicture}
[scale=.8,auto=left,every node/.style={circle,fill=blue!20}]
\node (n6) at (1,10) {6};
\node (n4) at (4,8) {4};
\node (n5) at (8,9) {5};
\node (n1) at (11,8) {1};
\node (n2) at (9,6) {2};
\node (n3) at (5,5) {3};
\foreach \from/\to in {n6/n4,n4/n5,n5/n1,n1/n2,n2/n5,n2/n3,n3/n4}
\draw (\from) -- (\to);
\end{tikzpicture}
\end{document}
produces:
More examples @ http://www.texample.net/tikz/examples/tag/graphs/
More information about TikZ: http://sourceforge.net/projects/pgf/ where I guess an installation guide will also be present.
