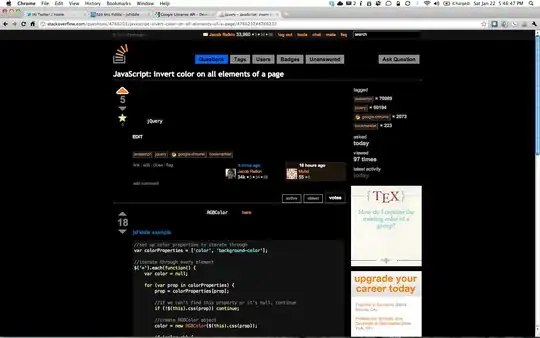
I am trying to create a react.js table that syncs with a leaflet map. I have this data and I am able to get the data properly, but I cannot create a table correctly. I am able to see the headers because they are hardcoded, but I am not able to see the rows. I also have a picture to explain the data at the console.log() points in the code. Here is the code:
/* Table React Component */
var TABLE_CONFIG = {
  sort: { column: "Zone", order: "desc" },
  columns: {
    col1: { name: "Zone", filterText: "", defaultSortOrder: "desc" },
    col2: { name: "Population", filterText: "", defaultSortOrder: "desc" }
  }
};

var Table = React.createClass({
  getInitialState: function() {
    var tabledata = [];
    var length = _.size(testJSON.zones);
    for(i = 0; i < length; i++) {

      var name = _.keys(testJSON.zones)[i];

      var population = testJSON.zones[name].population.value;
      if(name == "default") {
        population = testJSON.zones[name].population.default.value;
      }

      tabledata[i] = {name, population};
    }
    console.log(tabledata);
    return {zones: tabledata};
  },

  render: function() {
    var rows = [];
    this.state.zones.forEach(function(zone) {
        rows.push(<tr Population={zone.population} Zone={zone.name} />);
    }.bind(this));
    console.log(rows);
    return (
        <table>
            <thead>
                <tr>
                    <th>Zone</th>
                    <th>Population</th>
                </tr>
            </thead>
            <tbody>{rows}</tbody>
        </table>
      );
  }
});
Here you can see the console.log(tabledata) line in full as well as the first object in console.log(rows)

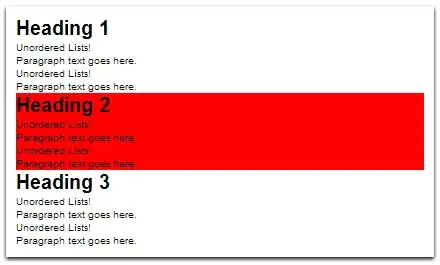
I would like to see something like the picture below. Please note I want to Zone column to not be editable input, but the population to be editable:
