I am making a chart that displays network latency and connection failure rate on graph. I am using DefaultCategoryDataset to store the data, but the problem is, that this dataset uses String for the X axis values:
  DefaultCategoryDataset dataset = new DefaultCategoryDataset( );
  dataset.addValue( 15 , "Line name" , "X value" );
Since I render packets based on Unix time in miliseconds, it ends up looking like this:
I'd like to fix it so that:
- New values (larger timestamp) appear to the right, not left
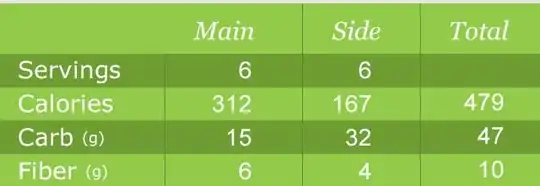
- X labels too close to each other are inteligently merged, as on this image:
To generate the dataset, I run over array of samples and end up with two HashMap<String, Double> representing average latency and failure rate. These are then assigned as follows:
//Latency line
for (Map.Entry<String, Double> entry : time.entrySet())
{
  dataset.addValue(entry.getValue(), "Average ping [ms]", entry.getKey());
}
//Fail rate line
for (Map.Entry<String, Double> entry : fail_rate.entrySet())
{
  dataset.addValue(entry.getValue()*100, "Fail rate [%]", entry.getKey());
}