0

I have the following plot:

enter image description here

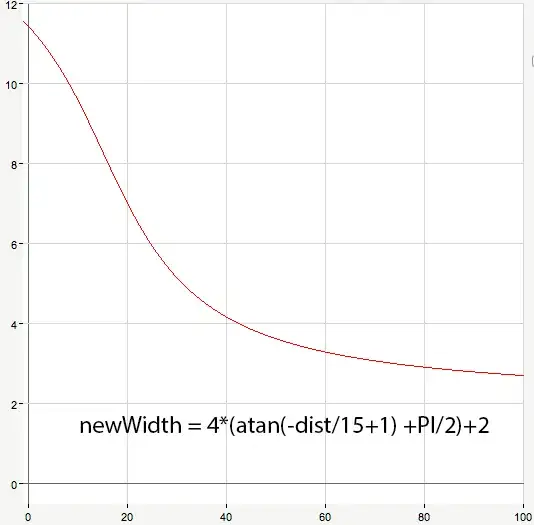
How can I achieve 3D plot like this for two dimensional array in Python? Say each line presented on the plot above is a single one dimensional array. I looked through matplotlib gallery https://matplotlib.org/gallery/, but there is nothing similar to the plot above.

Matt
  • 27,170
  • 6
  • 80
  • 74
bluevoxel
  • 4,978
  • 11
  • 45
  • 63
  • How do you do that in Matlab? Probably it is a wider code of diferent plots with `hold on` etc. – Ander Biguri Jun 15 '15 at 14:00
  • Unfortunately, I don't know how it's done in Matlab. I found aforementioned plot in currently read paper and it looked very "Matlabish". – bluevoxel Jun 15 '15 at 14:02
  • 2
    There is a [question](http://stackoverflow.com/questions/28751535/colored-mesh-plot-of-a-function-in-python) relating to this. – Jarvis Du Jun 15 '15 at 14:03
  • 1
    I dont think is made in Matlab. However, you could. But you need to write a piece of code that iteratively goes plotting the lines in the position. There is not a inbuilt 1 liner, sorry. – Ander Biguri Jun 15 '15 at 14:04

0 Answers0