I have an issue with the display of my plot lines in a Line Chart with drill down.
Every thing works fine, but when I drill down on year 2015 (where I only have 1 value per line), the plot lines do not show.
I have read about this issue in this post but all solutions are not acceptable as they disable the auto-scale on yAxis.
Here is what happens :
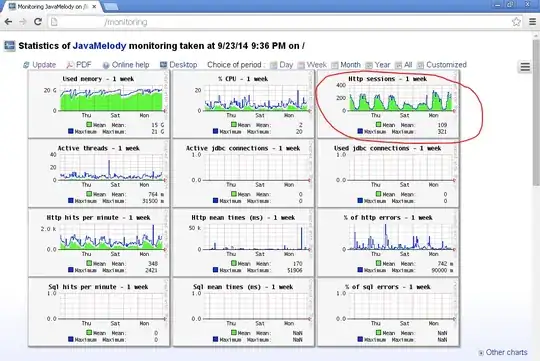
The normal chart (before drill down). It works perfectly:

The chart with a drill down on 2014 (Where I have 4 values per line). It works perfectly:

The chart with a drill down on 2015(Where I have 1 value per line). Plot lines do not show and the two points are at the same position:

Here is how I initialize my chart :
/*Initialisation du chart*/
            chart = new Highcharts.Chart({
                chart: {
                    renderTo: instanceData.id,
                    type: 'line',
                    alignTicks: false
                },
                title: {
                    text: titre_drill
                },
                subtitle: {
                    text: soustitre_drill
                },
                legend:{
                    enabled:true
                },
                xAxis: {
                    type: 'category'
                },
                yAxis: [{
                    title: {
                        text: texte_ordonee_expedie,
                        style: {
                            color: color_expedie
                        }
                    },
                    plotLines : [{
                        value : seuil_expedie,
                        color : color_expedie,
                        dashStyle : 'shortdash',
                        width : 2,
                        label : {
                            text : ''
                        }
                    }],
                    labels: {
                        format: '{value} €',
                        style: {
                            color: color_expedie
                        }
                    },
                    gridLineColor: 'transparent'
                },
                {
                    title: {
                        text: texte_ordonee_packee,
                        style: {
                            color: color_packee
                        }
                    },
                    plotLines : [{
                        value : seuil_packee,
                        color : color_packee,
                        dashStyle : 'shortdash',
                        width : 2,
                        label : {
                            text : ''
                        }
                    }],
                    labels: {
                        format: '{value} €',
                        style: {
                            color: color_packee
                        }
                    },
                    gridLineColor: 'transparent',
                    opposite: true //Pour que le deuxième axe soit à l'opposé du premier
                }],
                plotOptions: {
                    line: {
                        cursor: 'pointer',
                        marker: {
                            symbol: 'triangle'
                        },
                        dataLabels: {
                            enabled: false
                        }
                    }
                },
                tooltip: {
                    formatter: function() {
                        return '<b>'+ this.y +'</b> €<br/>';
                    }
                },
                series: main_data,
                drilldown: {
                    series: drilldown_series,
                    drillUpButton: {
                        relativeTo: 'spacingBox',
                        position: {
                            y: 0,
                            x: 0
                        }
                    }
                },
                exporting: {
                    enabled: true
                }
            });
I know there is not any native function in Highcharts to "always display" plot lines. Does anybody have a suggestion so I can display my two plot lines in the drilldown on 2015 ?