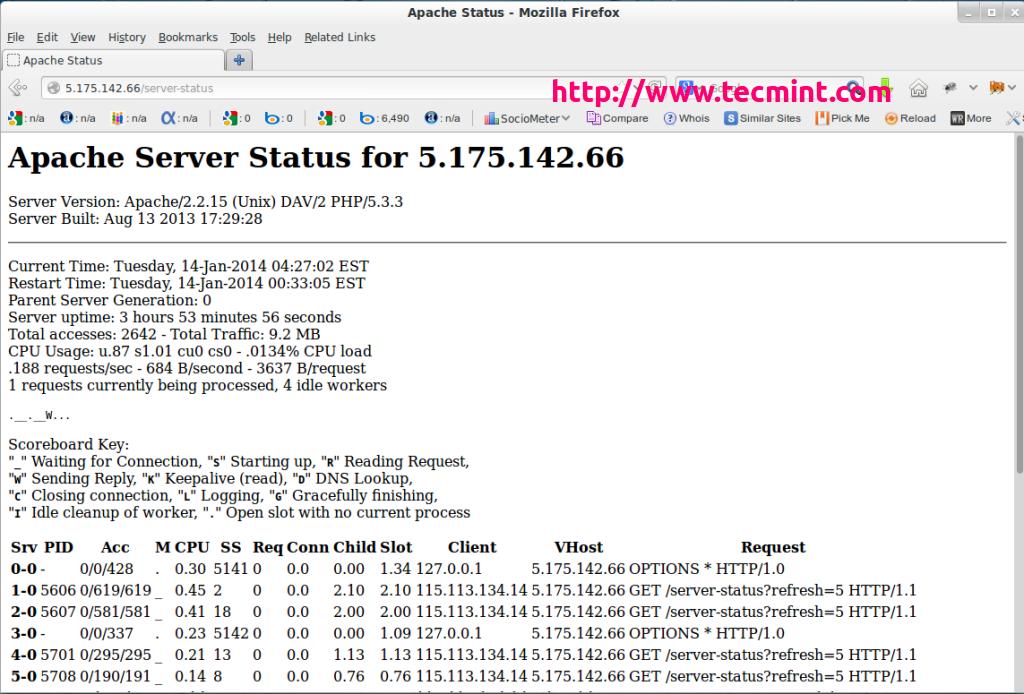
Is there a way to monitor the status of a puma server? most specifically, how many busy workers it has and how many threads each worker provisioned. best would be something similar to apache's mod_status
Asked
Active
Viewed 1.8k times
3 Answers
20
Maybe
$ touch /path/to/your/stats.txt
$ puma -S /path/to/your/stats.txt
in another terminal
$ watch cat /path/to/your/stats.txt
Results in:
---
pid: 14364
config: !ruby/object:Puma::Configuration
  cli_options:
  conf:
  options:
    :min_threads: 0
    :max_threads: 16
    :quiet: false
    :debug: false
    :binds:
    - tcp://0.0.0.0:9292
    :workers: 0
    :daemon: false
    :mode: :http
    :before_fork: []
    :worker_timeout: 60
    :worker_boot_timeout: 60
    :worker_shutdown_timeout: 30
    :state: /path/to/your/stats.txt
    :config_file:
    :control_auth_token: 21c9241912a8e0e7ddaabac667ff5682
    :tag: solar
    :environment: development
But that looks static :(
Starting your app via puma like this:
$ puma -S /path/to/your/stats.txt -C config/puma.rb --control tcp://0.0.0.0:9191 --control-token foo config.ru
allows you later to query per your webbrowser:
$ http://localhost:9191/stats?token=foo
or
$ pumactl -C tcp://0.0.0.0:9191 -T foo stats
Resulting in:
{ "workers": 3, "phase": 0, "booted_workers": 3 }
Which looks more dynamic...
Edit_0:
As workers are processes, one could also leverage tools provided by the operating system to gather information, e.g. on Linux:
Starting a puma instance:
puma -S p/stats.txt -C config/puma.rb --control tcp://0.0.0.0:9191 --control-token foo config.ru
[1908] Puma starting in cluster mode...
[1908] * Version 2.15.3 (ruby 2.1.5-p273), codename: Autumn Arbor Airbrush
[1908] * Min threads: 8, max threads: 32
[1908] * Environment: development
[1908] * Process workers: 3
[1908] * Preloading application
[1908] * Listening on tcp://0.0.0.0:9292
[1908] Use Ctrl-C to stop
[1908] * Starting control server on tcp://0.0.0.0:9191
[1908] - Worker 0 (pid: 1921) booted, phase: 0
[1908] - Worker 1 (pid: 1929) booted, phase: 0
[1908] - Worker 2 (pid: 1937) booted, phase: 0
Using top to investigate workers:
$ top -p1921 -p1929 -p1937 -n 1
gives us
Tasks:   3 total,   0 running,   3 sleeping,   0 stopped,   0 zombie
%Cpu(s):  8.4 us,  1.5 sy,  0.0 ni, 88.9 id,  1.2 wa,  0.0 hi,  0.0 si,  0.0 st
KiB Mem:   4058820 total,  1626576 used,  2432244 free,    56456 buffers
KiB Swap:  9609212 total,        0 used,  9609212 free.   424948 cached Mem

  PID USER      PR  NI    VIRT    RES    SHR S  %CPU %MEM     TIME+ COMMAND
 1921 benjamin  20   0 1171600  85484   3116 S   0.0  2.1   0:00.38 puma
 1929 benjamin  20   0 1171600  85264   2884 S   0.0  2.1   0:00.37 puma
 1937 benjamin  20   0 1171600  85264   2884 S   0.0  2.1   0:00.42 puma
from which one can parse out relevant information like CPU or RAM utilization.
benjamin
- 2,185
- 1
- 14
- 19
-
@Tal, in puma version 2.15.3 a call to "puma --help" shows a short documentation. I'll update my answer to show you the content... – benjamin Dec 12 '15 at 22:19
-
thx @benjamin, but unfortunately it seems that this doesn't provide the key info i am looking for, which is the state of the workers (busy/idle) – Tal Dec 13 '15 at 08:52
-
@Tal, I have updated the answer, the new part starts with **Edit_0**. But maybe https://github.com/hired/puma-stats-logger is for you? – benjamin Dec 13 '15 at 21:03
-
1thx @benjamin, right. this will (finally!) present the number of puma threads alongside information on which is active and which is idle. thx! only wish there was a way to know which URL they are currently handling (like apache's mod_status) – Tal Dec 14 '15 at 07:13
-
Note that you can get thread usage too from stats in puma version 3.7.1. https://github.com/puma/puma/pull/891/ – lingceng Feb 11 '18 at 09:20
0
You can use the pumactl tool:
$ pumactl --help
Yury Lebedev
- 3,985
- 19
- 26
-
3thx Yuri, but this doesn't allow me to monitor the number of workers/threads, which is what is required. am i missing something? – Tal Jun 23 '15 at 21:02