2

I am attempting to analyze a data set for a research project but have ran into a lot of issues, and have not been able to find a directly related answer online. I have worked with other statistical programs but am new to R. I have had the hardest time figuring out how to shape my data set to best answer questions.

In this research participants were asked to answer questions about pictures they were presented, these pictures were of faces exhibiting 3 emotions (happy, angry, sad) - I now want to compare answers given to each question in regards to those pictures. Meaning I want to see if there are differences between these three groups.

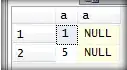
I have used a 1 way ANOVA in the past for doing this - in minitab I would put the images into 3 factors (1,2,3) and then the scores for the given question in the column next to it. So the specific picture and the score for the particular question would be lined up horizontally.

  Image pleasing
1     1        3
2     1        2
3     1        1
4     1        1
5     1        1
6     1        2

This is how I have it set up in R as well - but when I try to run an ANOVA I cannot because image is still the class of Integer and not a factor. Therefor it gives me this:

> Paov <- aov(Image ~ pleasing)
> summary(Paov)
             Df Sum Sq Mean Sq F value Pr(>F)
pleasing      1    0.7  0.6546   0.978  0.323
Residuals   813  544.3  0.6696               
26 observations deleted due to missingness

and then a post-hoc Tukey's test is meaningless. In minitab it was able to show me the mean score for pleasing as it related to each image and then tell me how they are significantly different. How can I make Image a factor in R? And then how can I properly compare these three groups in there scores of pleasing?

nobody
  • 19,814
  • 17
  • 56
  • 77
Keneggs
  • 23
  • 1
  • 1
  • 5
  • You have to "set up" your data in an appropriate manner for R. You wouldn't try to fly in the sky with a bike. You could try, but you most likely won't succeed unless you're ET! For a start do this df$Image <-factor(df$Image), where df is your data.frame. ANd please post a reproducibl example - tips here --> http://stackoverflow.com/questions/5963269/how-to-make-a-great-r-reproducible-example – infominer Jul 01 '15 at 23:27
  • 1
    You wouldn't try to fly in the sky with a bike. Meth, not even once. – thelatemail Jul 02 '15 at 00:18

1 Answers1

1

Given the description of your data, here's a way to perform the analysis of variance and the Tukey test. First, some not-so-random data (which will give "interesting" results):

set.seed(40)
dat <- data.frame(Image = factor(rep(1:3, each=10)), 
                  Pleasing = c(sample(1:2, 10, replace=T),
                               sample(c(1,3), 10, replace=T),
                               sample(2:3, 10, replace=T)))
head(dat)
#   Image Pleasing
# 1     1        2
# 2     1        2
# 3     1        2
# 4     1        1
# 5     1        1
# 6     1        1

The aov is quite simple. Just note you have to use data if your variables are in a dataframe (using attach isn't recommended):

dat.aov <- aov(Pleasing ~ Image, data=dat)
summary(dat.aov)
#             Df Sum Sq Mean Sq F value  Pr(>F)   
# Image        2    7.2   3.600   6.568 0.00474 **
# Residuals   27   14.8   0.548                   
# ---
# Signif. codes:  0 ‘***’ 0.001 ‘**’ 0.01 ‘*’ 0.05 ‘.’ 0.1 ‘ ’ 1

Now for the Tukey, there are different ways do it in R. I like to use the package multcomp because it provides more information with the results:

library(multcomp)

tukey <- cld(glht(dat.aov, linfct = mcp(Image = "Tukey")), decreasing = TRUE)

tukey$mcletters$Letters
#  1    2    3 
# "b" "ab"  "a" 

The syntax looks rather complicated because in multcomp you use a general linear hypothesis function (glht), in which you perform a multiple comparison (mcp) and then extract the compact letter display of the Tukey results (cld).

You can even plot the Tukey results, although the boxplots don't look very nice for this kind of data:

enter image description here

As a final note, it's important to mention that I use this kind of analysis for continuous data (experimental lab measures), and I'm not sure it's correct for your categorical data (1-3 expression choice).

Molx
  • 6,816
  • 2
  • 31
  • 47
  • why did you set up a seed? I have 143 participants answering questions about all three images. So I am trying to compare across images in regards to those images scores in a category (like pleasing). – Keneggs Jul 02 '15 at 21:42
  • The seed is only in order to make my example data reproducible. If you use the same seed and the same code for `dat`, the results will be identical. Without the seed they wouldn't, and that makes it hard to check if everything works fine for everyone who come across this answer. – Molx Jul 02 '15 at 21:52
  • Awesome, sorry i am very new to R. One more question, the replication here is distinguishing which score in pleasing go to which factor in image? also can i then put image into terms like this before running your same code line? Image <- factor(source$Image, levels =1:3) > levels(Image) <- c("Sad", "Happy", "Angry") > Image – Keneggs Jul 02 '15 at 22:04
  • That should work, but you must use the full reference to image, because it's a dataframe column, so `levels(data$Image) <- c("Sad", "Happy", "Angry")` – Molx Jul 02 '15 at 22:55