8

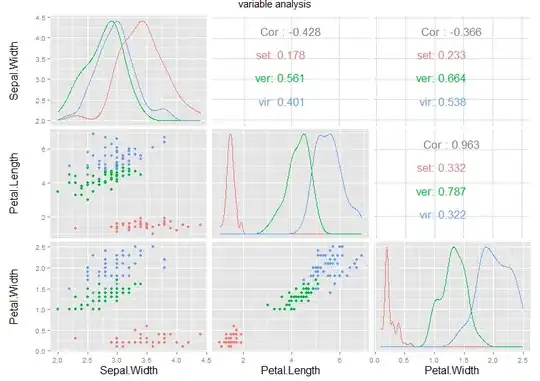
Do you know how to change the labels in an upper panel in ggpairs (Ggally package)? I found how to change size, font but not label. Here I want to shorten the label ("set" pour setosa etc...). I tried to put that in labels=c("set", "ver", "vir") or upper=list(params=list(size=8),labels=c("set", "ver", "vir")) but it doesn't work.

ggpairs(iris, columns=c(2:4), title="variable analysis", colour="Species",
        lower=list(params=list(size=2)), upper=list(params=list(size=8))) 

iris DATA GGPAIRS

tonytonov
  • 25,060
  • 16
  • 82
  • 98
catindri
  • 384
  • 5
  • 14
  • 1
    I can't test it, because your code is not [reproducible](http://stackoverflow.com/questions/5963269/how-to-make-a-great-r-reproducible-example), but you could try `theme(text= element_text(size = 8))` for smaller labels. – RHA Jul 02 '15 at 08:03
  • Thanks, I just put a reproductible example with iris dataset. But that I want is to change the labels (versicolor in "ver" etc...), not their size. – catindri Jul 02 '15 at 15:09
  • Also, the change of computer give not the same result in the image saved ! here it could be correct, but on my laptop, labels are hidden. – catindri Jul 02 '15 at 15:21

2 Answers2

3

It is a bit ugly, but you could do this (rename the levels in the plot):

library(GGally)
gplt <- ggpairs(iris, columns=c(2:4), 
        title="variable analysis", 
        colour="Species", 
        lower=list(params=list(size=2)), 
        upper=list(params=list(size=6)))

levels(gplt$data$Species)[levels(gplt$data$Species)=="versicolor"] <- "ver"
levels(gplt$data$Species)[levels(gplt$data$Species)=="virginica"] <- "vir"
levels(gplt$data$Species)[levels(gplt$data$Species)=="setosa"] <- "set"

print(gplt)

enter image description here

Mike Wise
  • 22,131
  • 8
  • 81
  • 104
3

Conceptually the same as @Mike's solution, but in one line.

levels(iris$Species) <- c("set", "ver", "vir")
ggplairs(<...>)

Here's another, more flexible proposal if you have many levels and do not want to abbreviate them by hand: trim levels to a desired length.

levels(iris$Species) <- strtrim(levels(iris$Species), 3)
ggplairs(<...>)

And by the way, the width parameter is also vectorized:

rm(iris)
strtrim(levels(iris$Species), c(1, 3, 5))
#[1] "s"     "ver"   "virgi"
tonytonov
  • 25,060
  • 16
  • 82
  • 98
  • Jeez, I thought the whole point was doing it without changing the data that generated the plot. – Mike Wise Jul 03 '15 at 09:33
  • @MikeWise Same thing applies to `levels(gplt$data$Species)`. The point is, there is no need to iterate over levels (imagine there's 100 factor levels). – tonytonov Jul 03 '15 at 09:48
  • 1
    I like how you renamed the levels. I should have tried something like that, what I did looked completely inelegant but it was late and I was sleepy. – Mike Wise Jul 03 '15 at 09:49