I have tried to come up with the simplest code to reproduce what I am seeing. The full program is below, but I will describe it here. Suppose I have class named ListData that just has some properties. Then suppose I have a MyList class that has a member List<ListData> m_list. Suppose m_list gets initialized in the MyList constructor.
In the main method I simply create one of these MyList objects, add a few ListData to it, then let it go out of scope. I take a snapshot in dotMemory after the ListData have been added, then I take another snapshot after the MyList object goes out of scope.
In dotMemory I can see that the MyList object has been reclaimed as expected. I also see that the two ListData objects that I created also got reclaimed as expected.
What I do not understand is why is there a ListData[] that survived?
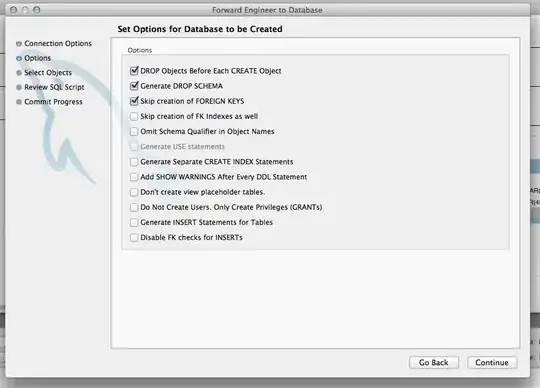
Here is a screen shot of this:

I open survived objects on the newest snapshot for the ListData[] then I view Key Retention Paths, this is what I see.

I am new to .NET memory management and I created this sample app to help me explore it. I downloaded the trial version of JetBrains dotMemory version 4.3. I am using Visual Studio 2013 Professional. I have to learn memory management so I can fix the memory issues we have at work.
Here is the full program that can be used to reproduce this. It is just a quick and dirty app but it will get the thing I am asking about if you profile it.
using System;
using System.Collections.Generic;
using System.Linq;
using System.Text;
using System.Threading.Tasks;

namespace ConsoleApplication1
{

    class ListData
    {
        public ListData(string name, int n) { Name = name; Num = n; }
        public string Name { get; private set; }
        public int Num { get; private set; }
    }

    class MyList
    {

        public MyList()
        {
            m = new List<ListData>();
        }

        public void AddString(ListData d)
        {
            m.Add(d);
        }

        private List<ListData> m;

    }


    class Program
    {
        static void Main(string[] args)
        {
            {
                MyList l = new MyList();
                bool bRunning = true;
                while (bRunning)
                {
                    Console.WriteLine("a or q");
                    string input = Console.ReadLine();
                    switch (input)
                    {
                        case "a":
                            {
                                Console.WriteLine("Name: ");
                                string strName = Console.ReadLine();
                                Console.WriteLine("Num: ");
                                string strNum = Console.ReadLine();
                                l.AddString(new ListData(strName, Convert.ToInt32(strNum)));
                                break;
                            }
                        case "q":
                            {
                                bRunning = false;
                                break;
                            }
                    }
                }
            }

            Console.WriteLine("good bye");
            Console.ReadLine();
        }
    }
}
Steps:
- Build above code in release.
- In dotMemory, select to profile a standalone app.
- Browse to the release exe.
- Select the option to start collecting allocation data immediately.
- Click Run.
- Take a snapshot immediately and name it "before". This is before any ListData have been added.
- In the app, type a and add two ListData.
- In dotMemory, take another snapshot and name it "added 2" because we added two ListData.
- In the app, type q to quit (the MyList will go out of scope). Before typing Enter again to exit the app, go take another snapshot in dotMemory. Name it "out of scope".
- In the app, type Enter to close the app.
- In dotMemory, compare the "added 2" and the "out of scope" snapshots. Group by namespace. You will see the ListData[] that I am referring to.
Notice that the MyList and the two ListData objects did get garbage collected but the ListData[] did not. Why is there a ListData[] hanging around? How can I make it get garbage collected?