This is a continuation of a question I posted earlier. I have a code.Rnw file in RStudio which I knit into a code.tex file using knit("code.Rnw") command.
I have a data frame that I am printing using the xtable command. In the example below, it is 20 rows. However, to save space, I am printing it out as two columns, each with 10 rows.
Below is my code:
\documentclass[11pt, a4paper]{article}
\usepackage[margin=3cm]{geometry}
\usepackage{longtable}

\begin{document}

<<echo=FALSE,results='asis'>>=
library(xtable)
set.seed(1)

spaceCol =  rep("     ",10)
df1 = data.frame(student = letters[1:10], vals=runif(10, 1, 10))
df2 = data.frame(student = letters[11:20], vals=runif(10, 1, 10))
dfFull = data.frame(df1,spaceCol,df2)
names(dfFull) = c(" ","% Correct","     "," ", "% Correct")
row.names(dfFull) = NULL

x.big <- xtable(dfFull, label ='tabtwo',caption ='Caption for table with student scores')
print(x.big, tabular.environment ='longtable', floating = FALSE, include.rownames=FALSE)
@

\end{document}
This is what the output looks like:

I like the aesthetics of this output, especially because in the longtable format, this output will automatically page-break if need be. However, what I am trying to improve, is to make it more easy to visualize that this output is really two distinct columns.
To do that, I would like to add a space between the two columns, so the output looks more as follows:
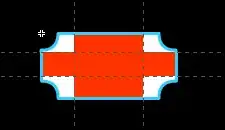
However, if that proves impossible, then I could consider something like adding a vertical line to distinguish the two columns, as shown below:

How might this be possible given my limitation in using xtable?