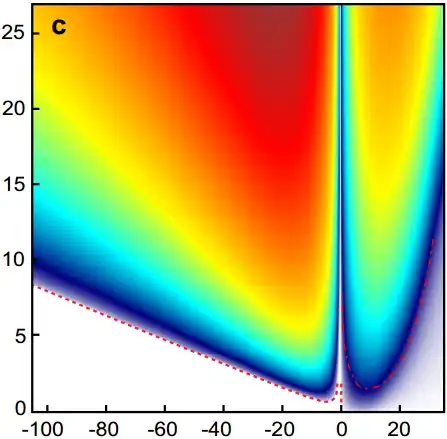
I have a calculated data (x,y) which I would like to put on top of an image from a paper to compare with some of its boundaries. If this image was a 2D x,y plot, I would have extracted easily the points and then plot together with mine. However this image is a 3D color plot, therefore if I want just to read the image, define my coordinates according to it and plot my data on top, so at the end would seem like 2 layers.
I can plot scatter points by following:
import matplotlib.pyplot as plt
im = plt.imread('fig_exp.png')
implot = plt.imshow(im)

# put a blue dot at (10, 20)
plt.scatter([10], [20], c='r', s=2000, marker=u'*')

plt.show()
But how can I define image coordinates so I can plot e.g
x=[-100,-80,-60,-40]
y=[10,15,20,25]
plt.plot(x,y,'-ro')
The problem here is that I dont know how to define the coordinates as in the figure. Beside I dont know how to plot not as scatter but a line.
I appreciate any helpful solution!