5

I have a plot with two line styles (solid and dashed). I would like them to be used for the same legend entry. The code below produces the typical legend, with two entries.

import matplotlib.pyplot as plt
import numpy as np

xy = np.linspace(0,10,10)

plt.figure()
plt.plot(xy,xy, c='k', label='solid')
plt.plot(xy,xy+1, c='k', ls='dashed', label='dashed')
plt.plot(xy,xy-1, c='k', ls='dashed')
plt.legend()

plt.show()

What I would like is something similar to this:

I have tried playing with proxy artists, but can't seem to get two lines, offset from each other to appear for one entry.

Blink
  • 1,444
  • 5
  • 17
  • 25
  • 1
    See http://stackoverflow.com/questions/21624818/matplotlib-legend-including-markers-and-lines-from-two-different-graphs-in-one/21630591#21630591 – tacaswell Jul 21 '15 at 19:04
  • http://stackoverflow.com/questions/18007022/two-unique-marker-symbols-for-one-legend/18007565#18007565 might also be helpful – tacaswell Jul 21 '15 at 19:05
  • @tcaswell Thanks for the suggestions. I used those to come up with my answer to another question I had before: http://stackoverflow.com/questions/28732845/combine-two-pyplot-patches-for-legend/. I just couldn't get anything to work with offsetting lines. – Blink Jul 22 '15 at 17:43

2 Answers2

14

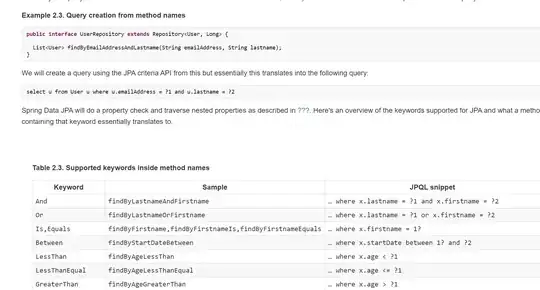
I made a custom legend handler based off of the HandlerLineCollection class. It figures out how many lines there are in the collection and spreads them out vertically.

Example image:Image with multi-line legend

Here's the handler:

from matplotlib.legend_handler import HandlerLineCollection
from matplotlib.collections import LineCollection
from matplotlib.lines import Line2D


class HandlerDashedLines(HandlerLineCollection):
"""
Custom Handler for LineCollection instances.
"""
def create_artists(self, legend, orig_handle,
                   xdescent, ydescent, width, height, fontsize, trans):
    # figure out how many lines there are
    numlines = len(orig_handle.get_segments())
    xdata, xdata_marker = self.get_xdata(legend, xdescent, ydescent,
                                         width, height, fontsize)
    leglines = []
    # divide the vertical space where the lines will go
    # into equal parts based on the number of lines
    ydata = ((height) / (numlines + 1)) * np.ones(xdata.shape, float)
    # for each line, create the line at the proper location
    # and set the dash pattern
    for i in range(numlines):
        legline = Line2D(xdata, ydata * (numlines - i) - ydescent)
        self.update_prop(legline, orig_handle, legend)
        # set color, dash pattern, and linewidth to that
        # of the lines in linecollection
        try:
            color = orig_handle.get_colors()[i]
        except IndexError:
            color = orig_handle.get_colors()[0]
        try:
            dashes = orig_handle.get_dashes()[i]
        except IndexError:
            dashes = orig_handle.get_dashes()[0]
        try:
            lw = orig_handle.get_linewidths()[i]
        except IndexError:
            lw = orig_handle.get_linewidths()[0]
        if dashes[0] != None:
            legline.set_dashes(dashes[1])
        legline.set_color(color)
        legline.set_transform(trans)
        legline.set_linewidth(lw)
        leglines.append(legline)
    return leglines

And here's an example of how to use it:

#make proxy artists
#make list of one line -- doesn't matter what the coordinates are
line = [[(0, 0)]]
#set up the line collections
lc = LineCollection(2 * line, linestyles = ['solid', 'dashed'], colors = ['black', 'black'])
lc2 = LineCollection(2 * line, linestyles = ['solid', 'dashed'], colors = ['blue', 'blue'])
lc3 = LineCollection(3 * line, linestyles = ['solid', 'dashed', 'solid'], colors = ['blue', 'red', 'green'])
#create the legend
plt.legend([lc, lc2, lc3], ['text', 'more text', 'extra line'], handler_map = {type(lc) : HandlerDashedLines()}, handlelength = 2.5)
Amy Teegarden
  • 3,842
  • 20
  • 23
  • Wow, thanks Amy. I hope you didn't write this just for me; it seems like a lot of work. It does indeed work very well and is exactly what I need. – Blink Jul 22 '15 at 17:44
  • Oh, no worries. I wouldn't have done it if I didn't think it was fun, and I mostly copied and modified an existing legend handler. @tcaswell, I would be happy to add it to the examples. I will have a look at the Developers' Guide and see if I can figure out how to do that. :) – Amy Teegarden Jul 22 '15 at 18:30
  • @Blink, I updated the code a bit. I wasn't calculating the line height properly, and things might look wrong if the handle height is changed. I fixed that. – Amy Teegarden Jul 23 '15 at 20:12
  • I'm unable to run this code, as I get several errors. Could anyone say what's the python version? – MrT77 Aug 05 '20 at 16:35
  • Everything after line ```class HandlerDashedLines(HandlerLineCollection):``` lacks an indentation – Emilio Jun 07 '21 at 08:17
8

Based on @Amys answer I build another implementation that extends the HandlerTuple to stack vertically, so you don't need to add a proxy artists.

import matplotlib.pyplot as plt
from matplotlib.legend_handler import HandlerTuple

class HandlerTupleVertical(HandlerTuple):
    def __init__(self, **kwargs):
        HandlerTuple.__init__(self, **kwargs)

    def create_artists(self, legend, orig_handle,
                       xdescent, ydescent, width, height, fontsize, trans):
        # How many lines are there.
        numlines = len(orig_handle)
        handler_map = legend.get_legend_handler_map()

        # divide the vertical space where the lines will go
        # into equal parts based on the number of lines
        height_y = (height / numlines)

        leglines = []
        for i, handle in enumerate(orig_handle):
            handler = legend.get_legend_handler(handler_map, handle)

            legline = handler.create_artists(legend, handle,
                                             xdescent,
                                             (2*i + 1)*height_y,
                                             width,
                                             2*height,
                                             fontsize, trans)
            leglines.extend(legline)

        return leglines

and then it can be used, using

line1 = plt.plot(xy,xy, c='k', label='solid')
line2 = plt.plot(xy,xy+1, c='k', ls='dashed', label='dashed')
line3 = plt.plot(xy,xy-1, c='k', ls='dashed', label='dashed')

plt.legend([(line1, line2), line3], ['text', 'more text', 'even more'],
           handler_map = {tuple : HandlerTupleVertical()})
m7thon
  • 3,033
  • 1
  • 11
  • 17
gyger
  • 197
  • 1
  • 10
  • Simple and works. Thanks! (Note that the indentation in the `for` loop is missing one space) – m7thon Jan 13 '17 at 14:14
  • Thank you for fixing. :) – gyger Jan 18 '17 at 14:48
  • Is it possible to do this when I plot each line individually? All of these answers seem to rely on plotting the lines compactly. In my application, `plot` is in a for loop... – kilojoules Jan 09 '18 at 19:42
  • You can store the lines produced in the for loop in an array. – gyger Feb 24 '18 at 06:46
  • 1
    I always get an error: Exception has occurred: AttributeError 'NoneType' object has no attribute 'create_artists' for line "legline = handler.create_artist...". Anyone can help me? – MrT77 Aug 04 '20 at 21:27
  • I agree, it is currently not working, unsure why though. – gyger Aug 11 '20 at 18:35
  • The reason it doesn't work is that `plt.plot` returns a *list* of things, so instead use something like `line1, = plt.plot(...)`. – lericson Jan 11 '22 at 13:56