14

In Python, how do I calcuate the peaks of a histogram?

I tried this:

import numpy as np
from scipy.signal import argrelextrema

data = [0, 1, 2, 3, 4, 0, 1, 2, 3, 4, 0, 1, 2, 3, 4, 1, 2, 3, 4,

        5, 6, 7, 8, 9, 5, 6, 7, 8, 9, 5, 6, 7, 8, 9,

        12,

        15, 16, 17, 18, 19, 15, 16, 17, 18, 

        19, 20, 21, 22, 23, 24,]

h = np.histogram(data, bins=[0, 5, 10, 15, 20, 25])
hData = h[0]
peaks = argrelextrema(hData, np.greater)

But the result was:

(array([3]),)

I'd expect it to find the peaks in bin 0 and bin 3.

Note that the peaks span more than 1 bin. I don't want it to consider the peaks that span more than 1 column as additional peak.

I'm open to another way to get the peaks.

Note:

>>> h[0]
array([19, 15,  1, 10,  5])
>>> 
wwii
  • 23,232
  • 7
  • 37
  • 77
brian
  • 773
  • 4
  • 9
  • 24
  • ```argrelextrema``` returns *local* maxima and minima - index three is the only local maxima in the array. How are you defining *peak*? You could write your own solution once you've defined the requirement and worked out the logic. – wwii Aug 10 '15 at 03:15
  • The accepted answer to [Finding local maxima/minima with Numpy in a 1D numpy array](http://stackoverflow.com/questions/4624970/finding-local-maxima-minima-with-numpy-in-a-1d-numpy-array) should get you on your way. – wwii Aug 10 '15 at 03:30
  • 1
    @wwii I'm not sure how to describe in words but I want where the derivatives would be zero if this was a continuous function and the slope approaching this is positive. – brian Aug 11 '15 at 01:02
  • What about the end points? – wwii Aug 11 '15 at 02:32
  • I want the endpoints to be inclusive. Ultimately I’d want it to find all max values if this was a continuous function. – brian Aug 11 '15 at 12:22
  • See the link in my previous comment. – wwii Aug 11 '15 at 18:40

3 Answers3

11

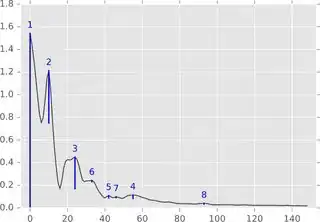
In computational topology, the formalism of persistent homology provides a definition of "peak" that seems to address your need. In the 1-dimensional case the peaks are illustrated by the blue bars in the following figure:

Most persistent peaks

A description of the algorithm is given in this Stack Overflow answer of a peak detection question.

The nice thing is that this method not only identifies the peaks but it quantifies the "significance" in a natural way.

A simple and efficient implementation (as fast as sorting numbers) and the source material to the above answer given in this blog article: https://www.sthu.org/blog/13-perstopology-peakdetection/index.html

S. Huber
  • 933
  • 13
  • 25
  • Hm, perhaps you can add a usage note/example for someone who isn't already familiar with computational topology? Say I have some list/array from which I plot my histogram - how do I use your example implementation, concretely. I noticed that `get_persistent_homology()` returns different results when the input is sorted or not. Also, what is returned exactly by that function? A list of `Peak` elements where each 'Peak' has left/right/born/died fields ... How do I get the 'real' peak from that? – maxschlepzig May 20 '22 at 10:28
5

Try the findpeaks library.

pip install findpeaks

# Your input data:
data = [0, 1, 2, 3, 4, 0, 1, 2, 3, 4, 0, 1, 2, 3, 4, 1, 2, 3, 4, 5, 6, 7, 8, 9, 5, 6, 7, 8, 9, 5, 6, 7, 8, 9, 12, 15, 16, 17, 18, 19, 15, 16, 17, 18,  19, 20, 21, 22, 23, 24,]

# import library
from findpeaks import findpeaks

# Find some peaks using the smoothing parameter.
fp = findpeaks(lookahead=1, interpolate=10)
# fit
results = fp.fit(data)
# Make plot
fp.plot()

Input data

# Results with respect to original input data.
results['df']

# Results based on interpolated smoothed data.
results['df_interp']
erdogant
  • 1,544
  • 14
  • 23
2

I wrote an easy function:

def find_peaks(a):
  x = np.array(a)
  max = np.max(x)
  length = len(a)
  ret = []
  for i in range(length):
      ispeak = True
      if i-1 > 0:
          ispeak &= (x[i] > 1.8 * x[i-1])
      if i+1 < length:
          ispeak &= (x[i] > 1.8 * x[i+1])
    
      ispeak &= (x[i] > 0.05 * max)
      if ispeak:
          ret.append(i)
  return ret

I defined a peak as a value bigger than 180% that of the neighbors and bigger than 5% of the max value. Of course you can adapt the values as you prefer in order to find the best set up for your problem.

squaregoldfish
  • 709
  • 8
  • 20