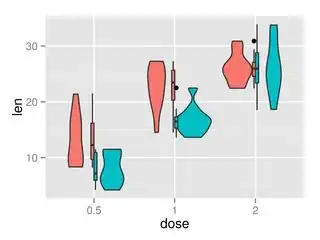
I want to graph a distribution along two dimensions using a violinplot with a boxplot in it. The result can be really fascinating, but only when done right.
ToothGrowth$dose <- as.factor(ToothGrowth$dose)
head(ToothGrowth)
plot <- ggplot(ToothGrowth, aes(x=dose, y=len, fill=supp)) +
  geom_violin() + geom_boxplot(width=0.1)  + theme(legend.position="none")
ggsave(filename="Violinboxplot.png", plot, height=6, width=4)
This is however what I get:
The boxplots are aligned along the axis belonging to the factor. How can I shift them to be in the center of the violinplots?
