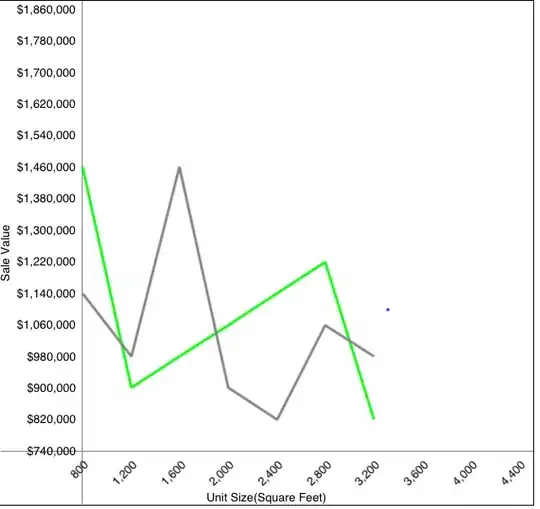
I have a developed a shiny app that displays Euro amounts on the y-axis label. It does not render in the plot output. How do I get around this issue?
The following is in the server.R:
plot(monthRange, euroPerMonth/1000,
     type="l",
     main="Cost",
     xlab="Months",
     ylab="€ (000)")
The closest I have come across is this; but, I am not sure how to apply this in shiny.
