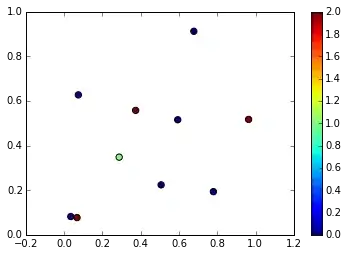
I'm trying to assign a color to points in a matplotlib scatter plot based on a value that is not related to the x or y value. Each point can be, for example, one of 3 values, so I want three different colors for the 3 possible values. So, there are 3 arrays: x_arr, y_arr and val_arr where each element of val_arr can be 1, 2 or 3. Seems like most of the examples I've seen have the color based on the position in the array, and not based on an independent value.
In order to get a high contrast between the 3 kinds of points for better visibility where there are many points, I've done something like this:
pt_color = plt.cm.Dark2(np.linspace(0, 1, 3))
What I cannot figure out is how to assign the right color for each value element. Conceptually, I would like to do something like this,
gr.scatter(x_arr, y_arr, c=val_arr, cmap=pt_color)
where each element of val_arr is mapped to a color using pt_color, but the above does not work (I get a TypeError because pt_color is unhashable type).
Any pointers are appreciated.
