4

I'm using imshow() to draw a 2D numpy array, so for example:

my_array = [[ 2.  0.  5.  2.  5.]
            [ 3.  2.  0.  1.  4.]
            [ 5.  0.  5.  4.  4.]
            [ 0.  5.  2.  3.  4.]
            [ 0.  0.  3.  5.  2.]]

plt.imshow(my_array, interpolation='none', vmin=0, vmax=5)

which plots this image:

enter image description here

What I want to do however, is change the colours, so that for example 0 is RED, 1 is GREEN, 2 is ORANGE, you get what I mean. Is there a way to do this, and if so, how?

I've tried doing this by changing the entries in the colourmap, like so:

    cmap = plt.cm.jet
    cmaplist = [cmap(i) for i in range(cmap.N)]
    cmaplist[0] = (1,1,1,1.0)
    cmaplist[1] = (.1,.1,.1,1.0)
    cmaplist[2] = (.2,.2,.2,1.0)
    cmaplist[3] = (.3,.3,.3,1.0)
    cmaplist[4] = (.4,.4,.4,1.0)
    cmap = cmap.from_list('Custom cmap', cmaplist, cmap.N)

but it did not work as I expected, because 0 = the first entry in the colour map, but 1 for example != the second entry in the colour map, and so only 0 is drawn diffrently:
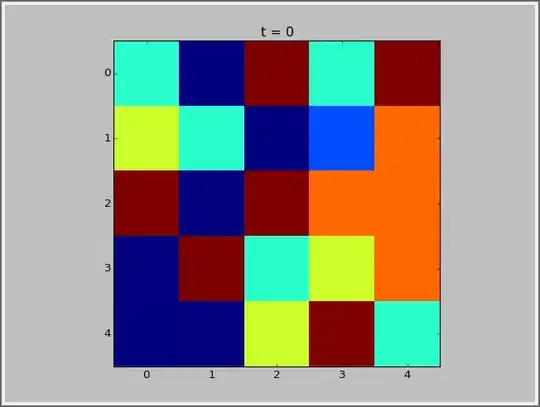
enter image description here

Amos
  • 1,154
  • 1
  • 16
  • 35
  • 1
    You'd need to make your own discrete colourmap. See [this question](http://stackoverflow.com/questions/14777066/matplotlib-discrete-colorbar). – areuexperienced Sep 24 '15 at 16:29
  • @areuexperienced I've tried using that to change the colourmap, but it didn't work as expected. Changing the first colour entry to (1, 1, 1, 1.0) for example works as expected; 0 in my numpy array is drawn as a white block. However, I thought that changing the second colour entry would correspond to 1 in my numpy array, but that's not the case. So changing them doesn't actually affect it the colours; 1-5 have stayed the same colour. – Amos Sep 24 '15 at 18:02

1 Answers1

10

I think the easiest way is to use a ListedColormap, and optionally with a BoundaryNorm to define the bins. Given your array above:

import matplotlib.pyplot as plt
import matplotlib as mpl

colors = ['red', 'green', 'orange', 'blue', 'yellow', 'purple']
bounds = [0,1,2,3,4,5,6]

cmap = mpl.colors.ListedColormap(colors)
norm = mpl.colors.BoundaryNorm(bounds, cmap.N)

plt.imshow(my_array, interpolation='none', cmap=cmap, norm=norm)

Because your data values map 1-on-1 with the boundaries of the colors, the normalizer is redundant. But i have included it to show how it can be used. For example when you want the values 0,1,2 to be red, 3,4,5 green etc, you would define the boundaries as [0,3,6...].

enter image description here

Rutger Kassies
  • 61,630
  • 17
  • 112
  • 97