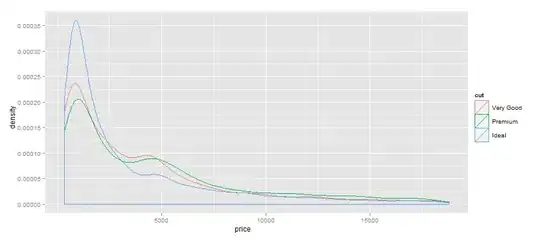
I would like to add the total number of observations per group on a density plot. I would like to know if stat_summary can be used for this. I have tried to find an example for this case and I can't find it. There are only examples for box plots. For example, I have followed this example: Use stat_summary to annotate plot with number of observations
adapting the code to my case, which is plotting a density graph.
n_fun <- function(x){
         return(data.frame(y = median(x), label = paste0("n = ",length(x))))
         }

ggplot(mtcars, aes(x=mpg, colour=factor(cyl))) +
geom_line(stat="density", aes(linetype=factor(cyl)), size=0.8) +
stat_summary(fun.data = n_fun, geom = "text")
and the error that I get is :
Error: stat_summary requires the following missing aesthetics: y
Only plotting the density plot works fine. The error appears when adding stat_summary
Help will be greatly appreciated.


