Are there any tools to build an impact graph like that of GitHub's, that can be run on repos that aren't on GitHub? Maybe something that spits out a nice PNG or a <canvas>-based HTML file?
Asked
Active
Viewed 883 times
3 Answers
5
Raphaël.js is a JavaScript library for manipulationg interactive SVG. They have a demo that is an impact graph : http://raphaeljs.com/github/impact.html
Suzanne Soy
- 3,027
- 6
- 38
- 56
3
The only platform I know of which could produce such a graph would be Hudson and its many plugins.
The Static Code Analysis Plugin, for instances, produces fairly advance graphs.

(source: hudson-ci.org)
None of the plugins propose exactly what you are looking for, but, combined with the Git Plugin, it is a start for creating new graphs.
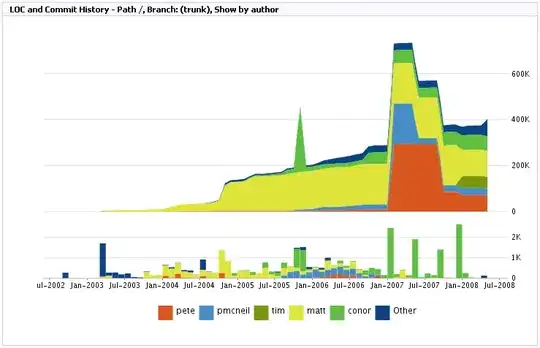
Another solution (not free except for open-source projects) would be an online code tracker like FishEye.
It has Graphs generation capabilities which are quite complete and much closer of what you want (but again, commercial product).

or:
Glorfindel
- 21,988
- 13
- 81
- 109
VonC
- 1,262,500
- 529
- 4,410
- 5,250
0
Okay, I too, came to this question hoping to find an easy answer and found none.
Fear not! I have fixed the problem.
Check out https://github.com/jtolds/git-impact
New project, generates nice interactive impact graphs from a git repo.
k0pernikus
- 60,309
- 67
- 216
- 347
jtolds
- 3,341
- 3
- 17
- 14
-
1(x-posted to http://stackoverflow.com/questions/2673052/how-to-generate-a-github-like-impact-graph, should these questions be merged?) – k0pernikus Jul 09 '15 at 19:29