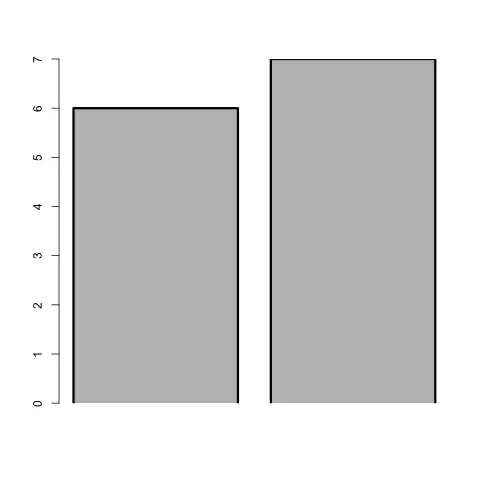
I would like to add the mean of each condition at the base of my bar chart in R. The final product looks something like this in excel (note the means are displayed at the base of each bar):

My current code is as follows:
pmrtBar <- ggplot(reslagdfClean,aes(x=Condition, y=PMMissProp*100)) + stat_summary(fun.y = mean, geom = "bar", fill = cbPalette) +
  theme(axis.title=element_text(size=12)) +
  stat_summary(fun.data = mean_cl_normal, geom = "errorbar", width=.1, size = .25) +
  coord_cartesian(ylim=c(0,50)) +
  labs(x = "Condition", y="Mean Mean Miss Proportion (%)") +
  apatheme
pmrtBar
I am new the R environment. Any feedback on the code above is also appreciated.
