6

I was learning more about threading, and i created a rather simple WPF application with the following code (x64 platform build)

public partial class MainWindow : Window
{
    public MainWindow()
    {
        InitializeComponent();

        for (var i = 0; i <= 20000; i++)
        {
            Thread thread = new Thread(Test);
            thread.IsBackground = true;

            thread.Start();
        }
    }

    public void Test()
    {
        Thread.Sleep(20000);
    }
}

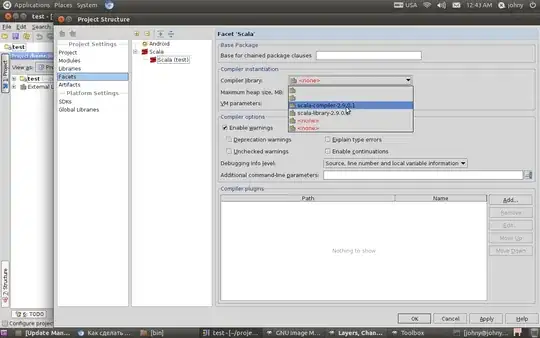
When i run this code, process takes approximately 560MB of RAM while all threads are running / sleeping.

Highest peak

Upon it's completion, process usage is down to aprox 125 MB of RAM.

My question is, why does process use 125 MB of RAM at that point, when application itself (without thread example) is using only 30 MB of RAM?

Does it keep some of the threads alive for possible re/usage or something else is going on?

EDIT:

Due to some suggestions how to improve this code, I would like to point out that I am not asking a way to improve it, but to pinpoint the reason for this behavior.

EDIT 2:

This is not a thread related, but I have tried a case with a large string list in memory, and it did not produce same results. When list was fully loaded in memory, it took about 1.3 GB of memory, but after list was set to NULL, and GC.Collect() was called, memory usage dropped back to 30 MB as expected.

Code:

public partial class MainWindow : Window
{
    List<string> stringArray = new List<string>();

    public MainWindow()
    {
        InitializeComponent();


        for (var i = 0; i <= 100000000; i++)
        {
            //Thread thread = new Thread(Test);
            //thread.IsBackground = false;

            //thread.Start();

            stringArray.Add("Some very long string to pump up the memory volume 2 reloaded");
        }

        stringArray = null;
        GC.Collect();
    }


}
Lowest peak

Robert
  • 3,353
  • 4
  • 32
  • 50
  • 1
    When a thread terminates the thread object becomes eligible for garbage collection at some indeterminate point in the future. – Alex K. Nov 21 '15 at 18:24
  • 5
    Well for starters,each thread gets a default 1MB stack allocated, so you have around 200MB added right there. – OldProgrammer Nov 21 '15 at 18:26
  • @AlexK. , i tried adding `GC.Collect();` upon each thread completion, but I am still stuck at ~125 MB of ram, even if I leave app to work for several minutes. It's never down to ~30 MB. – Robert Nov 21 '15 at 18:36
  • @Robert You shouldn't call `GC.Collect()` especially on a generational GC. Unlike Java, there should NEVER be any reason for 20000 Threads being created (unless you have 20000 CPUs). – Aron Nov 21 '15 at 18:53
  • @Aron it was just added for purpose of testing, the question is more oriented on why does RAM usage never drops to default 30MB, like it would it be if i never created any of those threads – Robert Nov 21 '15 at 18:55
  • 1
    @Aron If each thread is blocked by something external, there is reason for having a lot of threads... – Joe Phillips Nov 21 '15 at 18:56
  • @JoePhilllips That is EXACTLY my point. You shouldn't be blocking threads from something external. That is what async programming is for. – Aron Nov 21 '15 at 18:57
  • Thread class has a finalizer defined. Even after a GC they will be queued for finalization. Take a dump at that point (ram is 125 mb after GC) and see what is there in the heaps and in the finalization queue. I can help you with Windbg – Oguz Ozgul Nov 21 '15 at 19:11
  • 2
    And there is also one more possibility. When .net allocates memory (which is expensive), even after it is freed, .net may not release it and you may see the 125 mb because of this. As I said, please take a dump, and analyze it using windbg. This examination will also reveal the amount of free memory (free for managed heaps and stacks to use) which I assume to be close to 95 MB – Oguz Ozgul Nov 21 '15 at 19:34
  • 1
    20k objects are nothing, even if finalization was involved this would take near zero memory. Thread stacks are deallocated when the thread completes. The stack is not kept alive when the thread exits. Why would it? The question is valid. So far lots of commentary and upvoted comments but nobody has made any progress finding the answer. – usr Nov 21 '15 at 19:59
  • Does it need to be x64? I imagine if you built it under x86 it wouldn't eat up as much memory. – Darren Gourley Nov 21 '15 at 20:19
  • @darrengourley I have set it as x64, so i am able to instantiate over 1023 theads. I'm a fraid if i set low number of threads, difference will not be so noticeable. Please note that I am just trying to figure out what hapens under the hood, and not to find a best way to write this code. Took from this link: http://stackoverflow.com/questions/145312/maximum-number-of-threads-in-a-net-app – Robert Nov 21 '15 at 20:20
  • 1
    "*When i run this code, process takes approximately 560MB of RAM while all threads are running / sleeping.*" No! It uses 560MB of virtual memory, much of it reserved for thread stack space that will never be used. You are measuring virtual memory (address space) usage and thinking it's physical memory (RAM) usage. – David Schwartz Nov 21 '15 at 20:54
  • 1
    @DavidSchwartz thank you for your remarks. Would you please elaborate why does example number 1 and example number 2 does not produce the same result after the garbage collection? – Robert Nov 21 '15 at 21:09
  • 1
    @Robert `Thread` has a finalizer, so it will stay in memory after `GC.Collect`. Try to call `GC.Collect()`, `GC.WaitForPendingFinalizers()` and `GC.Collect()` again. I checked it with a console app and memory usage dropped. – Jakub Lortz Nov 21 '15 at 21:16
  • @JakubLortz thank you very much. This worked. If you set your answer as a question, i will mark it as answer :) – Robert Nov 21 '15 at 21:19
  • 1
    @Robert It's not clear what sense of "why" you mean. Do you mean what is the rationale? Or do you mean what is the mechanism? The rationale is that garbage collection is expensive and so doing more collection than needed is generally counter-productive. The mechanism is that the objects aren't ready to be collected when you call "collect" and doing extra work to make them ready would be counter-productive. – David Schwartz Nov 21 '15 at 21:41
  • 1
    @DavidSchwartz Thanks for the clarification. You helped a lot – Robert Nov 21 '15 at 21:52

3 Answers3

10

Part of the memory used by each thread is deallocated when the thread completes. That's why the memory consumption drops from 560 MB to 125 MB when all background threads complete.

The rest of the memory is allocated on the managed heap and will be freed by garbage collector.

When your application sits idle, no new memory is allocated, so there is no need for the garbage collector to run. You mentioned in a comment that forcing GC using GC.Collect() didn't help, but keep in mind that Thread has a finalizer implemented, so it will survive the first collection. You will have to use

GC.Collect();
GC.WaitForPendingFinalizers();
GC.Collect();

to make sure the memory is freed.

That should reduce the memory usage to the level before starting the threads.

Jakub Lortz
  • 14,616
  • 3
  • 25
  • 39
2

You are running a 64 bits application that just creates a lot of threads. First, it is important to know that running a Debug build of an application can yield different results than running a Release build because variables are artificially kept longer than needed in memory. Thus they will not be collected as soon as possible.

The Garbage Collector is highly optimized and will be triggered when:

  • The Gen0 has been fully allocated (the size of Gen0 is based on heuristics such as the rate at which your application do allocations etc);
  • The available memory is running out;
  • GC.Collect is called.

The reason the GC does not collect the memory as quickly as you thought is because there are simply no reason for the GC to collect memory. If your application would be running on a 32 bits platform, it would still have 1.5GB of memory available. In your case, you are running a 64 bits application: there is plenty memory available. However, if you were running a 'real' application with a lot more memory allocations, you would have a different outcome and probably a lot more collections (and thus a smaller working set).

Finally, calling GC.Collect is often unnecessary and can mess up the GC's heuristics which can badly impact the performance of your application because GC.Collect will trigger the collection of all the generations.

https://msdn.microsoft.com/en-us/library/xe0c2357(v=vs.110).aspx

Kzryzstof
  • 7,688
  • 10
  • 61
  • 108
0

Your threading mechanism is part of the problem. Besides it taking up so much cpu time during the execution (reducing the opportunity for garbage collection) it saw-tooth's your memory usage.

Something like this (minus the debugging information) will keep your memory consumption pretty even. And your CPU should be 'loafing' during the operation.(the static keyword is from my testing in a console application). .Net framework 4.0 or higher is required. If you are constrained to pervious versions of .net then I would suggest a slight pause before you start the new task to allow the garbage collection to do it's magic.

private static void ThreadStuff()
{
    long startSet = System.Diagnostics.Process.GetCurrentProcess().WorkingSet64;
    List<long> endSet = new List<long>();
    for (var i = 0; i <= 20000; i++)
    {
        Action Act = new Action(() => Test(i));

        Task Tsk = new Task(Act);
        Tsk.Start();
        endSet.Add(System.Diagnostics.Process.GetCurrentProcess().WorkingSet64);
        int worker;
        int ioCompletion;
        ThreadPool.GetMaxThreads(out worker, out ioCompletion);
        Console.WriteLine(worker);
        Console.WriteLine(ioCompletion);
    }
    Console.WriteLine(startSet.ToString("###,###,###,###,###,###.####"));
    Console.WriteLine(endSet.Average().ToString("###,###,###,###,###,###.####"));
}
public static void Test(int Index)
{
    Thread.Sleep(2000);
    Console.WriteLine(Index.ToString() + " Done");
}
Yuval Itzchakov
  • 146,575
  • 32
  • 257
  • 321
Paul
  • 176
  • 3
  • 16
  • i see that you are using tasks, but what if i change my code to be a foreground thread? Other than that, I am not looking a way to optimize my code, but a reason why memory usage never drops below 100 MB, even all threads completed several minutes ago. – Robert Nov 21 '15 at 19:31
  • 1
    This is a solution to a problem he is not asking to solve. He just wants to know *why* this happens. – usr Nov 21 '15 at 19:59
  • @usr: 'Why' it is happening is because of the mechanism he is invoking the threads Using a different mechanism makes the problem go away. – Paul Nov 21 '15 at 20:29
  • http://stackoverflow.com/questions/6331389/c-sharp-thread-not-releasing-memory for some explanations that are better than what I can provide. – Paul Nov 21 '15 at 20:30
  • @paul thank you for the link. I tried to test it by adding a `List` with aprox 100 million records in memory, and clear it after it. Memory usage was about 1.3 GB when list was full. After setting list back to null, GC did it's work, and i was down to 30 MB RAM usage – Robert Nov 21 '15 at 20:43
  • @Robert You seem to have some very fundamental misunderstandings about how memory and garbage collection work on a modern operating system. Specifically, you don't seem to understand what usage you're actually measuring or what kind of memory garbage collection returns and what it returns it to. You seem to think there's only this one thing called "memory" that is synonymous with "RAM". – David Schwartz Nov 21 '15 at 20:58