4

Upon adding the line plt.yscale('log') to my simple plotting script

import numpy as np
residuals = np.loadtxt('res_jacobi.txt', skiprows=1)

import matplotlib.pyplot as plt
fig = plt.figure()

steps = np.arange(0, len(residuals), 1)

plt.plot(steps, residuals, label='$S$')

plt.xlabel("Step",fontsize=20)
plt.ylabel("$S$",fontsize=20)
plt.ylim(0.95 * min(residuals), 1.05 * max(residuals))
plt.yscale('log')

plt.savefig('jacobi-res.pdf', bbox_inches='tight', transparent=True)

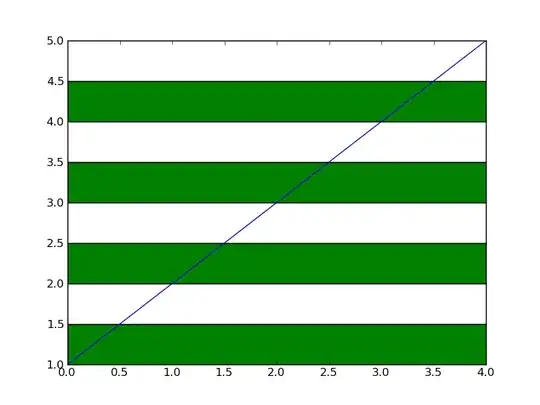
the y labels disappear.

enter image description hereenter image description here

I'm sure there is simple fix for this but searching did not turn one up. Any help would be much appreciated.
Janosh
  • 3,392
  • 2
  • 27
  • 35
  • seems like a bug, but you might try using `semilogy` http://matplotlib.org/api/pyplot_api.html#matplotlib.pyplot.semilogy – David Maust Nov 21 '15 at 18:41
  • 3
    @DavidMaust I don't think this is a bug, in log-scaling only the major tick-marks are labeled which are orders of magnitude. This is definitely not *optimal* behavior... however – DilithiumMatrix Nov 21 '15 at 18:51

2 Answers2

3

The normal behavior for matplotlib is to only label major tick marks in log-scaling --- which are even orders of magnitude, e.g. {0.1, 1.0}. Your values are all between those. You can:

  • rescale your axes to larger bounds,
    plt.gca().set_ylim(0.1, 1.0)
  • label the tick-marks manually,
    plt.gca().yaxis.set_minor_formatter(FormatStrFormatter("%.2f"))
DilithiumMatrix
  • 17,795
  • 22
  • 77
  • 119
  • With `plt.gca().set_yscale('semilog')`, it get the error `ValueError: Unknown scale type 'semilog'`. `plt.gca().set_yscale('log')` executes but still suffers from lack of labels. `plt.gca().set_ylim(0.1, 1.0)` works but choosing bounds sufficiently large to have y labels appear almost makes the plot look constant (yes, I know this means using a log scale is not necessary in the first place, but I'm just following instructions here). Thankfully, `plt.gca().yaxis.set_minor_formatter(FormatStrFormatter("%.2f"))` works great. Thanks! – Janosh Nov 21 '15 at 22:28
0

semilogy works for me.

Change:

plt.plot(steps, residuals, label='$S$')

Into:

plt.semilogy(steps, residuals, label='$S$')

Remove plt.yscale('log')

Mike Müller
  • 82,630
  • 20
  • 166
  • 161