Running in R this code:
# example data

x = runif(14, 0.0, 1.0)
norm = x/sum(x)
data = data.frame(replicate(17,sample(norm)))

require(ggplot2)
require(reshape2)

data$no <- seq_len(nrow(data))
data_molten <- melt(data, id.vars = "no")
data_molten[data_molten == 0] <- NA
View(data_molten)

# ggplot

ggplot(data_molten[!is.na(data_molten$value),], aes(x = variable, y = value, fill = factor(no))) +
    geom_bar(stat = "identity") +
    scale_fill_hue(l=40) + facet_grid(no~.) + theme_minimal() +
    theme(legend.position="none",
          axis.text.x = element_text(angle = 90, colour="black", vjust = 0.5, hjust=1, size=16),
          axis.title.x = element_blank(), axis.title.y = element_blank(),
          axis.line.y=element_blank(), axis.text.y=element_blank(), axis.ticks.y=element_blank(),
          strip.text.y=element_text(size = 16, colour="black", family="", angle=00,hjust = 0),
          panel.grid=element_blank(),
          axis.line=element_line(size = 1, colour = "black", linetype = "solid"),
          axis.ticks.x=element_line(size = 1, colour = "black", linetype = "solid"),
          panel.background=element_blank())
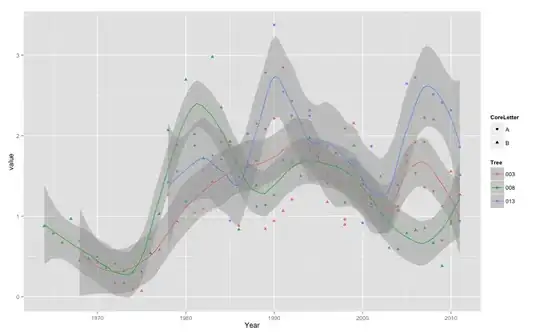
produces this plot:
Anybody knows how can I add a vertical line between the right side of the plot and the layers' labels (the 1, 2, 3, ..., 14) which have a tick per layer's label, keeping enough space between the plot, the axis and the labels?
EDIT:
Running
num_var_x = 14
num_var_y = 17

x = runif(num_var_x, 0.0, 1.0)
norm = x/sum(x)
data = data.frame(replicate(num_var_y,sample(norm)))

## preparing dataset for ggplot

require(ggplot2)
require(reshape2)
data$no <- seq_len(nrow(data))
data_molten <- melt(data, id.vars = "no")

data_molten_sort = data_molten[with(data_molten,order(no)),]

## removing elements from variable 'no' whose max. value is e.g. < 0.025

sequence = seq(from=1, to=(num_var_y*num_var_x-num_var_x)+1, by=num_var_x)
for(i in 1:length(sequence))
{
    if(isTRUE((max(data_molten_sort$value[(sequence[i]):((num_var_x+sequence[i])-(1))])) < 0.025))
    {
            data_molten_sort$value[(sequence[i]):((num_var_x+sequence[i])-(1))] = NA
    }
}

View(data_molten)


## preparing posterior exporting

#install.packages("Cairo"); "cairo" type in png() has a better quality
library("Cairo")
#preparing exporting
png(file="ggplot.png",type="cairo", width = 4, height = 5, units = 'in',pointsize=8,res=600)

## plotting

ggplot(data_molten[!is.na(data_molten$value),], aes(x = variable, y = value, fill = factor(no))) +
    geom_bar(stat = "identity") +
    scale_fill_hue(l=40) + facet_grid(no~., as.table=FALSE, scale="free_y", space = "free_y") + theme_minimal() +
    geom_vline(xintercept=max(as.numeric(data_molten$variable)) + 0.586, size=0.3) +
    theme(legend.position="none",
          axis.text.x = element_text(angle = 90, colour="black", vjust = 0.4, hjust=1, size=8),
          axis.title.x = element_blank(), axis.title.y = element_blank(),
          axis.line.y=element_blank(), axis.text.y=element_blank(), axis.ticks.y=element_blank(),
          strip.text.y=element_text(size = 8, colour="black", family="", angle=00,hjust = 0.1),
          panel.grid=element_blank(),
          axis.line=element_line(size = 0.3, colour = "black", linetype = "solid"),
          axis.ticks.x=element_line(size = 0.3, colour = "black", linetype = "solid"),
          panel.background=element_blank(), panel.margin = unit(0, "lines"))

## exporting barplot "ggplot.png" to directory
dev.off()
now the y line is continuous, plus other additions such as an exporting command.

