I've made a scatterplot in R using:
par(mfrow=c(1,2))
plot(x2~x1, pch=20, col=df$colour, cex=1.5, xlim=c(-4,16), ylim=c(-4,16))
with(df, text(x2~x1, labels = df$gene, pos = 4))
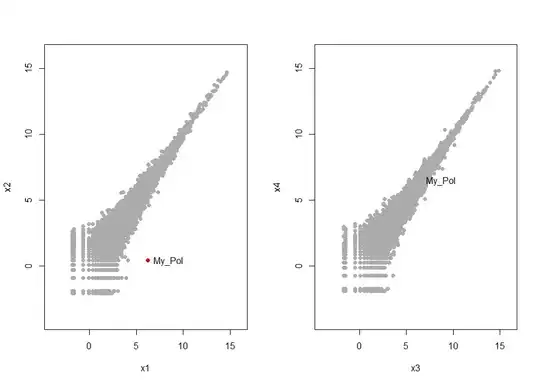
plot(x4~x3, pch=20, col=df$colour, cex=1.5, xlim=c(-4,16), ylim=c(-4,16))
with(df, text(x4~x3, labels = df$gene, pos = 4))
and I get something close to what i want, but i want the Red point of interest to be at the top of the stack in the second image. I've tried re-ordering the dataframe to have the single point both first and last in the dataframe but it doesn't alter the image, the point of interst is still hidden in the second plot. Any help would be much appreciated. Thanks!