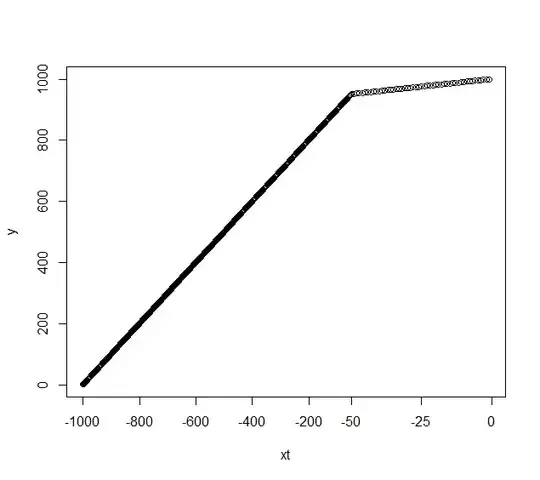
I have a very basic question. I have created a basic x,y-plot and for my x values which span from -1000 to 0 I would like to stretch last 50 units on x-axis so that from -1000 to -50 values are by default one unit apart but from -50 to 0 they should be 10 units apart. is this possible ??? and how would someone like me do this??
thank you
m
UPDATE: oh, sorry i thought .... well never mind, thnx for the tip:
example
x <- c(-1000:-1)
y <- c(1:1000)
plot(x,y)
Now the plot is simple linear but i would like to have last 50 x-ticks 10 units apart?? does this make sense??
