2

This question was marked as duplicate. I don't think it is a duplicate because the specific issues of

  • averaging over a time span measured in days for several years
  • and of missing data

Have not been dealt with elsewhere. I have worked on an answer which I am not allowed to paste in the original question. Therefore I paste it here.

Based on daily data for 15 years from 1993 to 2008. How to compute the daily average, for the variable Open in the file, for each day of the year, based on a 31 day Window centred on the day of interest. Thus, 15⨯31 = 465 dates contribute to the statistics of one day.

Output is just 365 values out of the 15 years

The file can be downloaded from here: http://chart.yahoo.com/table.csv?s=sbux&a=2&b=01&c=1993&d=2&e=01&f=2008&g=d&q=q&y=0&z=sbux&x=.csv

Community
  • 1
  • 1
Paul Rougieux
  • 10,289
  • 4
  • 68
  • 110

1 Answers1

2

Load packages and data

library(lubridate)
library(dplyr)
dtf <- read.csv("http://chart.yahoo.com/table.csv?s=sbux&a=2&b=01&c=1993&d=2&e=01&f=2008&g=d&q=q&y=0&z=sbux&x=.csv", stringsAsFactors = FALSE)
# I prefer lower case column names
names(dtf) <- tolower(names(dtf))    

The lubridate package has a nice function ddays() that adds a number of days. It deals with February 29. For example

ymd("2008-03-01") - ddays(15)
# [1] "2008-02-15 UTC"
ymd("2007-03-01") - ddays(15)
# [1] "2007-02-14 UTC"

Add minus15 and plus15 dates to the dataset, these will be the time bounds over which the average should be calculated for a given date in a given year.

dtf <- dtf %>% 
    mutate(date = ymd(date),
           minus15 = date - ddays(15),
           plus15 = date + ddays(15),
           monthday = substr(as.character(date),6,10),
           year = year(date),
           plotdate = ymd(paste(2008,monthday,sep="-"))) 

calendardays <- dtf %>% 
    select(monthday) %>% 
    distinct() %>%
    arrange(monthday) 

Create a function that gives the average over all those 15 years for a given day :

meanday <- function(givenday, dtf){
    # Extract the given day minus 15 days in all years available
    # Day minus 15 days will differ for example for march first 
    # in years where there is a february 29
    lowerbound <- dtf$minus15[dtf$monthday == givenday]
    # Produce the series of 31 days around the given day
    # that is the lower bound + 30 days
    filterdates <- lapply(lowerbound, function(x) x + ddays(0:30))
    filterdates <- Reduce(c, filterdates)
    # filter all of these days 
    dtfgivenday <- dtf %>%
        filter(date %in% filterdates) 
    return(mean(dtfgivenday$open))
}

Use that function over all dates available in the calendar:

meandays <- sapply(calendardays$monthday, meanday, dtf)
calendardays <- calendardays %>% 
    mutate(mean = meandays,
           plotdate = ymd(paste(2008,monthday,sep="-")))

Plots

plot(dtf$date,dtf$open,type="l")
library(ggplot2)
ggplot(dtf, aes(x=date,y=open, color = as.factor(year))) + geom_line()
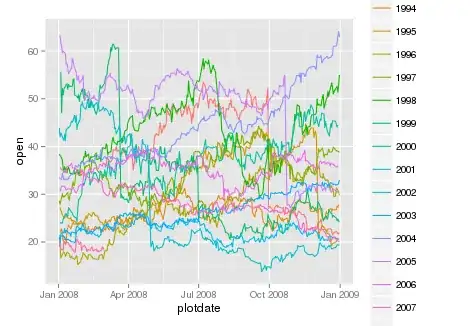
ggplot(dtf, aes(x=plotdate,y=open, color = as.factor(year))) + geom_line()
ggplot(calendardays, aes(x=plotdate, y=mean)) + geom_line()

Time series

All series on one year

Plot of the moving average

Is it strange to see a periodicity appear here?

Paul Rougieux
  • 10,289
  • 4
  • 68
  • 110
  • The final plot represents the average of all moving averages ? for instance:For a date 2008-02-07 you take the average of 31 days (15 before and 15 after). You do the same for 2007-02-07 and 2006-02-07...and so on for all year days (all seventh of February). then you average all these values to get final value for 02-07? Is this what you done in your answer? – bic ton Dec 30 '15 at 10:44
  • 1
    Yes in a way, except that it's not an average of averages, but rather an average over 15*31 = 465 values directly. There are 15 time windows of 31 days: 15 days before and 15 days after 2008-02-07, the same for 2007-02-07 and 2006-02-07...and so on. `meanday("02-07")` returns the average of the `open` variable within the 15 time windows. – Paul Rougieux Dec 30 '15 at 10:55
  • I guess this the final values:`> head(meandays) 01-02 01-03 01-04 01-05 01-06 01-07 27.78185 29.25146 32.05867 34.79089 33.76463 32.12979 `. Is it possible to have it in tow cols named `date value` – bic ton Dec 30 '15 at 10:58
  • Last thing:I need to subtract all original values from this average,for instance,all seventh of February - this value `02-07`, all eighth of February - this value `02-08` and so on ... – bic ton Dec 30 '15 at 11:01