10

Anyone know if it is possible to wrap the xtick labels in matplotlib? Right now I've got the following code (kind of messy -- been hacking at it for a while):

def plotResults(request, question_id):
 responses = ResponseOption.objects.filter(question__id=question_id).order_by('order').annotate(response_num=Count('response'))

 counts = []
 labels = [] 

 for response in responses:
  counts.append(response.response_num)
  labels.append(smart_truncate('$'+response.text+'$'))

 N = len(labels)
 labels = tuple(labels)
 counts = tuple(counts)
 ind = na.array(range(N))+0.5
 width = .35
 fig = Figure(facecolor='white',edgecolor='white')
 ax = fig.add_subplot(1,1,1)


 rects1 = ax.bar(ind, counts,linewidth=0)

 ax.set_ylabel('$Count$')

 ax.set_title('$Response Historgram$')
 ax.set_xticks(ind+width)
 ax.set_xticklabels(labels)

 print mpl.matplotlib_fname()

 canvas = FigureCanvas(fig)
 response = HttpResponse(content_type='image/png')

 canvas.print_png(response)

 return response

That generates this plot:

alt text

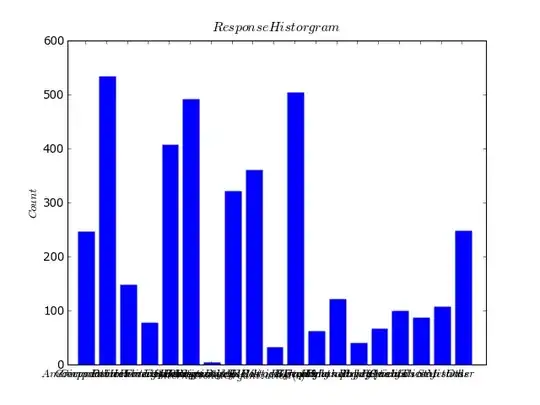
As you can see the xticks are boned. Any ideas on how to wrap them, or baring that make them readable? Thanks again!

PS: This is part of a Django project. I return the plot as a png image -- normally call them from img tags in various views.

Amro
  • 123,847
  • 25
  • 243
  • 454
biased_estimator
  • 723
  • 3
  • 7
  • 13
  • 1
    `rotation = 'vertical'` might be the answer: http://stackoverflow.com/questions/1221108/barchart-with-vertical-labels-in-python-matplotlib – unutbu Aug 12 '10 at 02:40
  • 1
    @~unutbu: `rotation` can be any angle, see: http://matplotlib.sourceforge.net/api/axes_api.html#matplotlib.axes.Axes.set_xlabel – Amro Aug 12 '10 at 02:44
  • @Amro, thanks. `xticks(rotation=45)` might look better... – unutbu Aug 12 '10 at 02:48
  • # Wrapping the bar labels of a bar plot using matplotlib https://stackoverflow.com/a/70443275/17736138 – Shrey Shah Dec 22 '21 at 01:47

2 Answers2

13

Perhaps try:

ax.set_xticklabels(labels, rotation=45)

Thanks to Amro for pointing out that rotation can be any degree.

unutbu
  • 842,883
  • 184
  • 1,785
  • 1,677
  • 1
    or in one call: `ax.set_xticklabels(labels, rotation=45)`: http://matplotlib.sourceforge.net/api/axes_api.html#matplotlib.axes.Axes.set_xticklabels – Amro Aug 12 '10 at 02:54
  • @Amro, thanks again. If you'd like to post an answer I'd be glad to delete mine. – unutbu Aug 12 '10 at 02:58
  • thats ok, I guess it was your idea :) – Amro Aug 12 '10 at 03:00
  • 1
    When I do `plt.savefig(os.path.join(sys.argv[1],'image.png'))` the labels go off the page of the image. Why is this? Do I need a `subplot`instead of doing `plt.xticks(args...),rotation=45)` directly to the main `plt.bar`? – Dhruv Ghulati Sep 06 '16 at 17:22
  • If rotation causes the labels to go off the image using savefig, add `bbox_inches='tight'` to the call. – Ginger Jun 04 '21 at 14:51
  • Without respecifying the labels: `ax.set_xticklabels(ax.get_xticklabels(), rotation=45)` – Mateen Ulhaq Aug 03 '21 at 05:18
10

If you want to wrap the labels manually you can insert a '\n' into the label name, which will break the label into two lines at the point you have the '\n'. You can see an example of this here.

There also appears to be an autowrap function now that seems to do the trick nicely. This example uses plt.text, but it's an attribute you can specify with plt.xticks, too. (i.e. wrap=True) I found this kind of messed up the alignment of the labels, so I needed to tweak the horizontal and vertical alignments as well.

Ben
  • 2,308
  • 2
  • 18
  • 25
  • 1
    The text wrap=True was the perfect solution for my horizontal bar plot with long ytick labels. While the OP seemed to be asking for and accepted rotation as an answer, your answer to the "wrap" question was perfect. Thank you. – BalooRM May 14 '20 at 13:50
  • 1
    How did you apply this to the ytick labels? – KevOMalley743 May 07 '21 at 11:30
  • 1
    @KevOMalley743, I believe it should be the same, just use ax.set_yticklabels or plt.yticks. – Ben Mar 21 '22 at 13:01