5

I am having a weird problem that when trying to attach am application with NSight, there is no available processes showing up in the list.

I am trying to debug CUDA code. So I attached my VS2012 project to an application (MATLAB). It used to work fine, but until yesterday there is no available process to attach somehow. Weird.

Here is the things I have done:

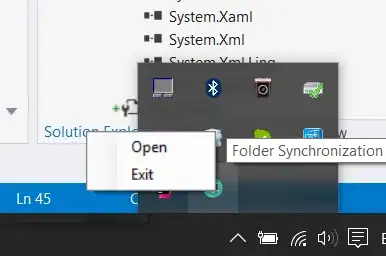
  1. NSight 5.0 Setup: enter image description here enter image description here

  2. Environment NSIGHT_CUDA_DEBUGGER = 1 in both personal and system settings. enter image description here

  3. Open VS2012 project and -> tools -> attach to process -> Nsight GPU Debugger enter image description here enter image description here

In Step 3, there is no processing showing up. And once I chose Nsight GPU Debugger and my localhost, the Nsight says it is already connected.

I am using VS2012 Pro, Windows 7, CUDA 7.5, and Nsight 5.0. Any help is greatly appreciated.
Nick X Tsui
  • 2,737
  • 6
  • 39
  • 73

4 Answers4

3

Check which display driver version you have installed. From the release notes of Nsight 5.0:

From the NVIDIA web site, download and install the following display driver (or newer):

Driver Release 355.85, Release 355 or newer

Also, you may need to start the monitor with Admin rights in Windows 7.

dquam
  • 101
  • 4
  • 1
    Thank you. Starting the Nsight monitor with admin rights fixed the "empty process list" problem for me on Windows 8.1 x64 – masterxilo Feb 14 '17 at 18:51
1

I solved this issue by downgrading NSight to 4.5, as well as the drive that fits NSight 4.5

For Nsight 5.0, I could not get it work anyway. The driver version was right, but it just did not work as far as I have tried.

Nick X Tsui
  • 2,737
  • 6
  • 39
  • 73
1

When this happened to me, checking and un-checking the "show processes from all users" button triggered the dialog to be repopulated.

Jeremy Cowles
  • 1,171
  • 1
  • 9
  • 13
0

There are a few things need your confirm.

  1. Since your NSIGHT_CUDA_DEBUGGER is set in system ENV, you need to reboot your machine to take it effect.

  2. In host side, you set Enable secure connection to True. Then you need give the same setting in Monitor side. Keep your settings consistent.

  3. There is an operation trick when attach. Switch to Default transport first and back to Nsight GPU Debugger. Now Qualifier field is blank. Then choose localhost. It since triggers a new connection. If you keep in Nsight GPU Debugger, it doesn't work.

Qian Zhang
  • 71
  • 1
  • I think the secure connection true is for monitor side, bcause I set it via nsight monitor, no? Then how do I set secure connection on both sides? Care to explain a little more? Thanks. – Nick X Tsui Jan 21 '16 at 14:25
  • OOPS. Your first screenshot is from Monitor side. I thought it was host side. Sorry. Then you need to check your host setting. In Visual Studio, click Nsight menu -> Options -> General -> Enable secure connection. Set this to true as well. Do you try step 3? Does it resolve your problem? Thanks. – Qian Zhang Jan 22 '16 at 08:05