89

I’d like to include a legend or key in my GraphViz diagram. I’m having trouble figuring out what code to use, though. I also want to put it in a corner, but the only coord I know for sure is the bottom-left: pos="10,10!".

Does anyone know how I can get this to work?

Ilmari Karonen
  • 49,047
  • 9
  • 93
  • 153
Synetech
  • 9,643
  • 9
  • 64
  • 96
  • I have just filed an [issue](https://gitlab.com/graphviz/graphviz/-/issues/2231) against GraphViz regarding this matter - asking for either official documentation on creating legends, or facilities which would make them easier to create. – einpoklum Apr 12 '22 at 08:11

9 Answers9

60
digraph {
  rankdir=LR
  node [shape=plaintext]
  subgraph cluster_01 { 
    label = "Legend";
    key [label=<<table border="0" cellpadding="2" cellspacing="0" cellborder="0">
      <tr><td align="right" port="i1">item 1</td></tr>
      <tr><td align="right" port="i2">item 2</td></tr>
      <tr><td align="right" port="i3">item 3</td></tr>
      <tr><td align="right" port="i4">item 4</td></tr>
      </table>>]
    key2 [label=<<table border="0" cellpadding="2" cellspacing="0" cellborder="0">
      <tr><td port="i1">&nbsp;</td></tr>
      <tr><td port="i2">&nbsp;</td></tr>
      <tr><td port="i3">&nbsp;</td></tr>
      <tr><td port="i4">&nbsp;</td></tr>
      </table>>]
    key:i1:e -> key2:i1:w [style=dashed]
    key:i2:e -> key2:i2:w [color=gray]
    key:i3:e -> key2:i3:w [color=peachpuff3]
    key:i4:e -> key2:i4:w [color=turquoise4, style=dotted]
  }
  ...

enter image description here

I used dot.

Mark Rajcok
  • 362,217
  • 114
  • 495
  • 492
35

I'm deeply convinced that graphviz should not be used this way, but you may use HTML labels to achieve what you want:

digraph  { 

Foo -> Bar -> Test;
Foo -> Baz -> Test;

{ rank = sink;
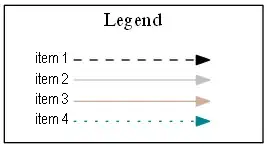
    Legend [shape=none, margin=0, label=<
    <TABLE BORDER="0" CELLBORDER="1" CELLSPACING="0" CELLPADDING="4">
     <TR>
      <TD COLSPAN="2"><B>Legend</B></TD>
     </TR>
     <TR>
      <TD>Foo</TD>
      <TD><FONT COLOR="red">Foo</FONT></TD>
     </TR>
     <TR>
      <TD>Bar</TD>
      <TD BGCOLOR="RED"></TD>
     </TR>
     <TR>
      <TD>Baz</TD>
      <TD BGCOLOR="BLUE"></TD>
     </TR>
     <TR>
      <TD>Test</TD>
      <TD><IMG src="so.png" SCALE="False" /></TD>
     </TR>
     <TR>
      <TD>Test</TD>
      <TD CELLPADDING="4">
       <TABLE BORDER="1" CELLBORDER="0" CELLSPACING="0" CELLPADDING="0">
        <TR>
         <TD BGCOLOR="Yellow"></TD>
        </TR>
       </TABLE>
      </TD>
     </TR>
    </TABLE>
   >];
  }
} 

That's what this looks like:

graphviz output

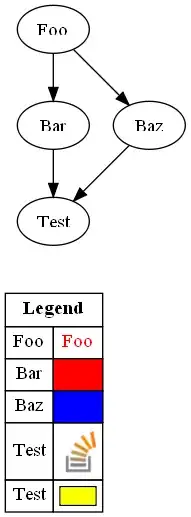
The positioning of the Legend has to be done like any other node (I used rank=sink to get it to the bottom) - you may play with its margin attribute for fine-tuning the position.

Edit:

Without using labels, that may be the direction to go for - I'm not sure whether it is to completely eliminate ranksep.

digraph  { 
 mindist=0;
 ranksep=0;
 nodesep=0;

 node[shape=box,margin="0,0",width=1, height=0.5];
 edge [style=invis];

 Legend[width=2];
 Legend -> Foo;
 Legend -> FooValue;
 Foo -> Bar;
 FooValue -> BarValue
 Bar -> Baz;
 BarValue -> BazValue;

 edge [constraint=false];
 Foo -> FooValue;
 Bar -> BarValue
 Baz -> BazValue;
 }

Resulting in:

enter image description here

marapet
  • 54,856
  • 12
  • 170
  • 184
  • That looks good in terms of layout, but it requires manually entering each item in the table as opposed to using the existing node objects. My attempt tried subgraphs and clusters, but neither was reliable enough to control the layout of the table (I understand that the engine is responsible for deciding on the optimal layout of a normal graph, but a table is easy to layout optimally, no fancy calculation should be required; a rectangle is simple enough). – Synetech Jan 21 '11 at 18:00
  • 1
    I wasn't aware that the legend had to be composed of nodes - I updated the response with an example going into that direction, without success, at least if you need the gridlines. I don't think that what you'd like to obtain is possible, even with fancy calculations. Other tools may be better suited for that task. – marapet Jan 25 '11 at 21:37
  • 3
    **> I wasn't aware that the legend had to be composed of nodes** Well the legend is about the graph, and the graph is composed of nodes and lines. **> I don't think that what you'd like to obtain is possible, even with fancy calculations. Other tools may be better suited for that task.** That would be unfortunate; it seems odd that a graphing utility cannot provide a crucial part of a graph. :( – Synetech Jan 27 '11 at 02:25
  • 4
    It would be a useful addendum to enumerate why you are deeply convinced that this shouldn't be done. – Davos Nov 28 '17 at 03:43
16

Lots of these anwers show nice ways to render a legend, and that's useful, but a major unaddressed problem is integration of that legend in the same output as the main graph. This causes all sorts of problems because things like rankdir and rank positions "leak" between the main diagram and the legend, making it hard to improve one without breaking the other.

After trying several ways of embedding a key within the main GraphViz image, I've decided that for me, it makes more sense to simply put the legend into its own, separate dot file, render it as it's own, separate, image, and then display the images side-by-side in my documents/pages.

This has a few advantages:

  • The .dot source code is substantially simpler.
  • It's very easy to change the rankdir of the legend graph to display the nodes above one another, or side-by-side, to produce a key that either sits to the right of the main image, or below it.
  • No leaking of things like rank positions from the main graph into the legend.

For example:

Graph of nodes Horizontal legend

Jonathan Hartley
  • 15,462
  • 9
  • 79
  • 80
  • 5
    You can use ImageMagick to merge them: `dot -Tpng graph.gv > graph.png && dot -Tpng legend.gv > legend.png && convert graph.png legend.png -append combined.png` – kelloti Jul 09 '21 at 05:24
7

I had some luck with the following. I didn't like how wide it was, but otherwise it worked.

subgraph cluster1 {
    label = "Legend" ;
    shape = rectangle ;
    color = black ;
    a [style=invis] ;
    b [style=invis] ;
    c [style=invis] ;
    d [style=invis] ;
    c -> d [label="only ts", style=dashed, fontsize=20] ; 
    a -> b [label="ts and js", fontsize=20] ;
    gui -> controller [style=invis] ;
    view -> model [style=invis] ;
    builtins -> utilities [style=invis] ;

    gui [style=filled, fillcolor="#ffcccc"] ;
    controller [style=filled, fillcolor="#ccccff"] ;
    view [style=filled, fillcolor="#ccffcc"] ;
    model [style=filled, fillcolor="#ffccff"] ;
    builtins [style=filled, fillcolor="#ffffcc"] ;
    utilities ;
    "external libraries" [shape=rectangle] ;
}

The result was

Result

Brian Burns
  • 20,575
  • 8
  • 83
  • 77
Theodore Norvell
  • 15,366
  • 6
  • 31
  • 45
  • How does this combine with the main graph? – einpoklum Apr 12 '22 at 08:01
  • The file starts like this `digraph Depends { size="9,6.5" ; splines="polyline" ; nodesep=0.2 ; ranksep=0.2 ; ratio=fill; rankdir = LR ; node[fontsize=20]; subgraph cluster1 { ` Then after the subgraph come the regular nodes and edges. – Theodore Norvell Apr 26 '22 at 03:25
4
subgraph cluster_01 {
    label = "Legend";
    node [shape=point]
    {
        rank=same
        d0 [style = invis];
        d1 [style = invis];
        p0 [style = invis];
        p1 [style = invis];
        s0 [style = invis];
        s1 [style = invis];
    }
    d0 -> d1 [label=deprecated style=dashed]
    p0 -> p1 [label=proposed style=dotted]
    s0 -> s1 [label=stable]
}

enter image description here

steamer25
  • 9,278
  • 1
  • 33
  • 38
3

There are some problems if you use graph [splines=ortho] : the lines are in inverse order.

Dot source:

digraph {
  rankdir=LR
  node [shape=plaintext]
  graph [splines=ortho]
  subgraph cluster_01 { 
    label = "Legend";
    key [label=<<table border="0" cellpadding="2" cellspacing="0" cellborder="0">
      <tr><td align="right" port="i1">item 1</td></tr>
      <tr><td align="right" port="i2">item 2</td></tr>
      <tr><td align="right" port="i3">item 3</td></tr>
      <tr><td align="right" port="i4">item 4</td></tr>
      <tr><td align="right" port="i5">item 5</td></tr>
      </table>>]
    key2 [label=<<table border="0" cellpadding="2" cellspacing="0" cellborder="0">
      <tr><td port="i1" bgcolor='greenyellow'>&nbsp;</td></tr>
      <tr><td port="i2">&nbsp;</td></tr>
      <tr><td port="i3">&nbsp;</td></tr>
      <tr><td port="i4">&nbsp;</td></tr>
      <tr><td port="i5">&nbsp;</td></tr>
      </table>>]
    key:i1:e -> key2:i1:w [color=red]
    key:i2:e -> key2:i2:w [color=gray]
    key:i3:e -> key2:i3:w [color=peachpuff3]
    key:i4:e -> key2:i4:w [color=turquoise4, style=dotted]
    key:i5:e -> key2:i5:w [color=red, style=dotted]
  }
}
wonea
  • 4,783
  • 17
  • 86
  • 139
luandrea
  • 301
  • 2
  • 8
2

I'm trying to do the same. I have been using a subgraph to make a key of node types:

digraph G {

    rankdir=RL;
    graph [fontsize=10 fontname="Verdana"];

    node [style=filled height=0.55 fontname="Verdana" fontsize=10];
    subgraph cluster_key {
        label="Key";
        progress [fillcolor="wheat" label="In progress"];
        todo [label="To do"];
        done [fillcolor=palegreen3 label="Done"];
        not_our [fillcolor=none label="Not our\nteam"];
        numbers [color=none label="Numbers\nrepresent\nperson\ndays"];
        progress -> done [style=invis];
        todo -> progress [style=invis];
        not_our -> todo [style=invis];
        numbers -> not_our [style=invis];
    }
    mappings [fillcolor=palegreen3];
    identifiers [fillcolor=palegreen3];
    hyperwarp [fillcolor=wheat];
    ghost [fillcolor=none]
    UI [fillcolor=none]
    events [fillcolor=wheat];
    flag [fillcolor=palegreen3];
    groups [fillcolor=wheat];
    types [fillcolor=wheat];
    instances [];
    resources [];
    optimize [];
    remove_flag [];
    persist [];
    approval [];

    edge [style="" dir=forward fontname="Verdana" fontsize=10];
    types -> flag;
    groups -> events;
    events -> {flag mappings identifiers};
    ghost -> hyperwarp;
    UI -> ghost;
    resources -> identifiers;
    optimize -> groups;
    hyperwarp -> flag;
    instances -> {ghost UI types events hyperwarp flag};
    resources -> {groups flag};
    remove_flag -> approval;
    persist -> approval;
    approval -> {types resources instances};
}

which results in

Graph with legend for node types

But on reflection, seeing the difficulty I'm having to position the legend alongside the main graph, the way the position of node rankings in the main graph affects those in the legend, and the complication in the source that this introduces, I'm tempted to try a different approach (see my other answer, use a separate graph for the key)

beaver
  • 523
  • 1
  • 9
  • 20
Jonathan Hartley
  • 15,462
  • 9
  • 79
  • 80
0

This works well for simpler legends (from: https://forum.graphviz.org/t/adding-key-or-legend/351)

diagraph.png

digraph l {
  subgraph clusterMain {
      graph [labelloc="b" labeljust="r" label=<
<TABLE BORDER="0" CELLBORDER="1" CELLSPACING="0">
<TR><TD>left 1</TD><TD>right 1</TD></TR>
<TR><TD>left 2</TD><TD>right 2</TD></TR>
</TABLE>>];
      "x" "y"
      a -> b -> c
  }
}
Orwellophile
  • 13,235
  • 3
  • 69
  • 45
0

A revelatory contribution to this issue is the existence of 'gvpack', installed as part of GraphViz.

Put your graph and its legend into a single .dot file, as two separate graph{} or digraph{} entities.

gvpack combines those graphs into a single graph, taking care not to let them overlap, with a granularity you can control with command-line options. eg:

gvpack -u combined.dot
(outputs a lot of .dot language)

The resulting single graph can be fed to your normal invocation of 'dot' or 'neato' or whatever.

gvpack -u combined.dot | dot -o -Tsvg combined.svg
Jonathan Hartley
  • 15,462
  • 9
  • 79
  • 80