0

I would like to plot a superposition of a long list of time series objects.

class(ts.l)
# [1] "list"
class(ts.l[[1]])
# [1] "xts" "zoo"

I know that ts.plot() can do that. So, when I invoke the command ts.plot(as.ts(ts.l[[1]]), as.ts(ts.l[[2]]), as.ts(ts.l[[2]])) it works.

But I don't know how to give the whole list to ts.plot() all at once. The following code lines both do not work:

ts.plot(unlist(sapply(ts.l, as.ts)))

This seems to merge the time series into a single series.

ts.plot(sapply(ts.l, as.ts))

Produces an error message

Object cannot be coerced to type double

So, does anyone know how to handle this?

Joshua Ulrich
  • 173,410
  • 32
  • 338
  • 418
CodingButStillAlive
  • 733
  • 2
  • 8
  • 22

2 Answers2

2

The new plot.xts in the development version of xts on GitHub handles multi-column xts objects. For example:

require(xts)
data(sample_matrix)
# create list of xts objects
ts.l <- as.list(as.xts(sample_matrix))
# merge xts list into one object
ts.o <- do.call(merge, ts.l)
plot(ts.o)

enter image description here

Joshua Ulrich
  • 173,410
  • 32
  • 338
  • 418
  • Thanks! So, this will not work with the CRAN xts package? – CodingButStillAlive Jan 26 '16 at 12:31
  • In my case I do not have time series with multivariate features, but an array (i.e. a list) of several univariate time series objects. – CodingButStillAlive Jan 26 '16 at 12:32
  • @user1881788: No, this will not work with the current xts version on CRAN. If you want to plot several univariate series on the same coordinates, the time index of each series must be aligned, so you effectively *do* have a time series with multivariate features. My example was simply illustrative, since you did not provide a [reproducible example](http://stackoverflow.com/q/5963269/271616). – Joshua Ulrich Jan 26 '16 at 12:41
  • Thanks a lot! That's exactly what I wanted! Great ;) – CodingButStillAlive Jan 27 '16 at 13:38
  • But just in general I would like to know how to feed a list into a function that expects a (...) argument. Like I wrote in the beginning `ts.plot(as.ts(ts.l[[1]]), as.ts(ts.l[[2]]), as.ts(ts.l[[2]]))` works, but `ts.plot(unlist(sapply(ts.l, as.ts)))` does not. Best! – CodingButStillAlive Jan 27 '16 at 13:40
  • @user1881788: you can use `do.call` to construct the call. Using `ts.l` from my example: `do.call(ts.plot, lapply(ts.l,as.ts))`. – Joshua Ulrich Jan 27 '16 at 14:25
1

I use the following function to transform xts objects into a format that ggplot2 can work with:

xts_to_dataframe = function(..., xts_ids) {
  xts_list = list(...)
  all_include_stop_time = all(sapply(xts_list, function(x) return(!is.null(attr(x, 'stop_timestamps')))))
  names_null = sapply(xts_list, function(x) is.null(names(x)))
  if (any(names_null)) stop('Some xts objects do not have a valid `names` attribute.')
  data_frame_list = lapply(xts_list, function(xts_obj) {
    xts_vars = lapply(names(xts_obj), function(xts_variable) {
      output = data.frame(timestamps = index(xts_obj[,xts_variable]), 
                          values = as.vector(xts_obj[,xts_variable]))
      if (all_include_stop_time) {
        output = cbind(output, stop_timestamps = attr(xts_obj, 'stop_timestamps'))
      }   
      return(output)
    })  
    combined_data_frame = do.call('rbind', xts_vars)
    rownames(combined_data_frame) = NULL
    combined_data_frame[['variable']] = rep(names(xts_obj), sapply(xts_vars, nrow))
    return(combined_data_frame)
  })  
  combined_data_frame_list = do.call('rbind', data_frame_list)
  if (missing(xts_ids)) xts_ids = seq_along(data_frame_list)
  combined_data_frame_list[['xts_obj_id']] = rep(xts_ids, sapply(data_frame_list, nrow))
  return(combined_data_frame_list)
}

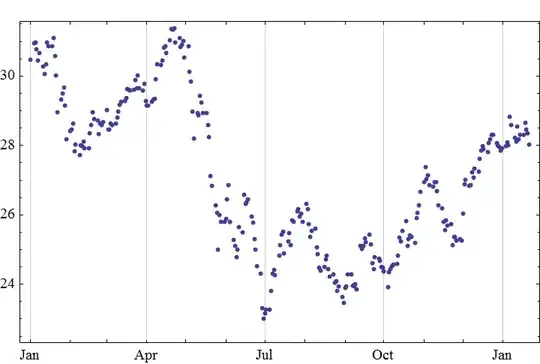
Just feed it a bunch of xts objects, and the resulting data.frame can be plotted using ggplot2. For example:

ggplot(plot_data, aes(x = timestamps, y = values, color = xts_obj_id)) + geom_point() 
Paul Hiemstra
  • 59,984
  • 12
  • 142
  • 149
  • Thanks a lot for your efforts. However, how should I call this function? `df <- xts_to_dataframe(ts.l, names(ts.l))` does not work. – CodingButStillAlive Jan 26 '16 at 10:42
  • Essentially, my xts objects do not have name attributes. `names(ts.l[[1]])` is equal to NULL. However, `names(ts.l)` is defined, of course. – CodingButStillAlive Jan 26 '16 at 10:47
  • Because of the `...` you need to explicitly name the final argument. You can also simply omit it like this: `df <- xts_to_dataframe(ts.l)`. – Paul Hiemstra Jan 26 '16 at 11:00
  • Omitting also gives an error: "incorrect number of dimensions". This is probably because I do not have "multiple time series objects" but only univariate ones. I guess I need to do something like `sapply(ts.l, function(x) names(x) <- "var_name")` or so!? – CodingButStillAlive Jan 26 '16 at 12:13
  • Have you tried using `zoo::autoplot.zoo` or `zoo::fortify.zoo`? I'm not familiar with either function, but it appears they should do something very similar to what your function does. They should work with xts objects, since xts extends zoo. – Joshua Ulrich Jan 26 '16 at 12:14