Nice conical intersections you have there:)
What you're trying to do should be achieved by setting the Z data you want to ignore to NaN. Using graphene's tight binding band structure as an example:
import numpy as np
import matplotlib.pyplot as plt
from mpl_toolkits.mplot3d import Axes3D

# generate dummy data (graphene tight binding band structure)
kvec = np.linspace(-np.pi,np.pi,101)
kx,ky = np.meshgrid(kvec,kvec)
E = np.sqrt(1+4*np.cos(3*kx/2)*np.cos(np.sqrt(3)/2*ky) + 4*np.cos(np.sqrt(3)/2*ky)**2)

# plot full dataset
fig = plt.figure()
ax = fig.add_subplot(111, projection='3d')
ax.plot_surface(kx,ky,E,cmap='viridis',vmin=-E.max(),vmax=E.max(),rstride=1,cstride=1)
ax.plot_surface(kx,ky,-E,cmap='viridis',vmin=-E.max(),vmax=E.max(),rstride=1,cstride=1)


# focus on Dirac cones
Elim = 1  #threshold
E[E>Elim] = np.nan

fig = plt.figure()
ax = fig.add_subplot(111, projection='3d')
#ax.plot_surface(kx2,ky2,E2,cmap='viridis',vmin=-Elim,vmax=Elim)
#ax.plot_surface(kx2,ky2,-E2,cmap='viridis',vmin=-Elim,vmax=Elim)
ax.plot_surface(kx,ky,E,cmap='viridis',rstride=1,cstride=1,vmin=-Elim,vmax=Elim)
ax.plot_surface(kx,ky,-E,cmap='viridis',rstride=1,cstride=1,vmin=-Elim,vmax=Elim)

plt.show()
The results look like this:
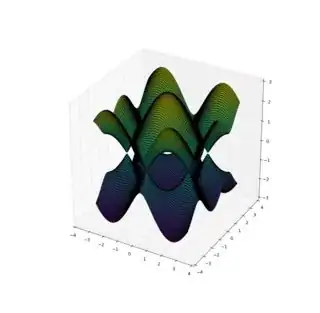
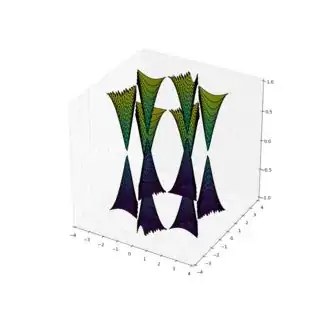
Unfortunately, there are problems with the rendering of the second case: the apparent depth order of the data is messed up in the latter case: cones in the background are rendered in front of the front ones (this is much clearer in an interactive plot). The problem is that there are more holes than actual data, and the data is not connected, which confuses the renderer of plot_surface. Matplotlib has a 2d renderer, so 3d visualization is a bit of a hack. This means that for complex overlapping surfaces you'll more often than not get rendering artifacts (in particular, two simply connected surfaces are either fully behind or fully in front of one another).
We can get around the rendering bug by doing a bit more work: keeping the data in a single surface by not using nans, but instead colouring the the surface to be invisible where it doesn't interest us. Since the surface we're plotting now includes the entire original surface, we have to set the zlim manually in order to focus on our region of interest. For the above example:
from matplotlib.cm import get_cmap

# create a color mapping manually
Elim = 1  #threshold
cmap = get_cmap('viridis')
colors_top = cmap((E + Elim)/2/Elim) # listed colormap that maps E from [-Elim, Elim] to [0.0, 1.0] for color mapping
colors_bott = cmap((-E + Elim)/2/Elim) # same for -E branch
colors_top[E > Elim, -1] = 0 # set outlying faces to be invisible (100% transparent)
colors_bott[-E < -Elim, -1] = 0

# in nature you would instead have something like this:
#zmin,zmax = -1,1 # where to cut the _single_ input surface (x,y,z)
#cmap = get_cmap('viridis')
#colors = cmap((z - zmin)/(zmax - zmin))
#colors[(z < zmin) | (z > zmax), -1] = 0
# then plot_surface(x, y, z, facecolors=colors, ...)

# or for your specific case where you have X, Y, Z and C:
#colors = get_cmap('viridis')(C)
#colors[(z < zmin) | (z > zmax), -1] = 0
# then plot_surface(x, y, z, facecolors=colors, ...)

fig = plt.figure()
ax = fig.add_subplot(111, projection='3d')
# pass the mapped colours as the facecolors keyword arg
s1 = ax.plot_surface(kx, ky, E, facecolors=colors_top, rstride=1, cstride=1)
s2 = ax.plot_surface(kx, ky, -E, facecolors=colors_bott, rstride=1, cstride=1)
# but now we need to manually hide the invisible part of the surface:
ax.set_zlim(-Elim, Elim)

plt.show()
Here's the output:

Note that it looks a bit different from the earlier figures because 3 years have passed in between and the current version of matplotlib (3.0.2) has very different (and much prettier) default styles. In particular, edges are now transparent in surface plots. But the main point is that the rendering bug is gone, which is evident if you start rotating the surface around in an interactive plot.


