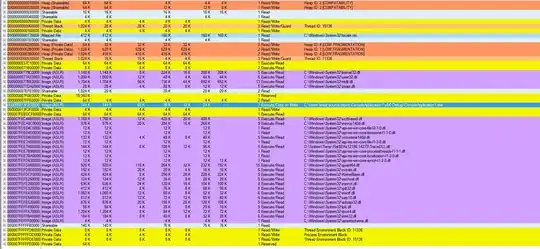
I am trying to produce a graph similar to this:
from a database with many tables (as x axis).
The Data:
I have several tables in the database as follow: Table1, Table2, Table3, etc Each table has 500+ rows and 10+ columns (attributes)
The Problem
one of those columns contains the condition (fair, good, very good and etc) of that message.
the query that returns this in the database:
SELECT message_condition Condition,
COUNT(message_id) NumMessage
FROM `table1` GROUP message_condition
this will return :
------------------------
Condition |  NumMessage
------------------------
          |  80
Fair      |  20
Good      |  60
Ideal     |  50
Great     |  80
UPDATE: There are always 4 conditions with one null condition (for messages with no condition). So if I run the query for all tables, I will get same table as above but with different numbers.
Now, I want to apply these query to all tables in the database so I can produce the above graph ( with table as x axis).
I tried to use this method:
doCountQuerys <- function(con, table) {
    query <- paste('
        SELECT message_condition Condition,
        COUNT(message_id) NumMessage FROM`', table, '` GROUP message_condition', sep = '')
    ts     <- dbGetQuery(con, query)
    return(ts)
}

lists <- dbListTables(con)  # get list of all tables in the database

countz <- numeric(0)       # store the counts for all tables

for (i in 1:length(list)) {
    counta <- doCountQuerys(con, lists[i])
    countz[i] <- counta[[1]]
    #print(countz[[1]])
}
but I get this error:
## Warning in countz[i] <- counta[[1]]: number of items to replace is not a
## multiple of replacement length
I don't think I am doing this correctly,any idea how to run that query through all tables in R and produce that graph?

