14

I am looking to find the peaks in some gaussian smoothed data that I have. I have looked at some of the peak detection methods available but they require an input range over which to search and I want this to be more automated than that. These methods are also designed for non-smoothed data. As my data is already smoothed I require a much more simple way of retrieving the peaks. My raw and smoothed data is in the graph below.

enter image description here

Essentially, is there a pythonic way of retrieving the max values from the array of smoothed data such that an array like

    a = [1,2,3,4,5,4,3,2,1,2,3,2,1,2,3,4,5,6,5,4,3,2,1]

would return:

    r = [5,3,6]
GeoMonkey
  • 1,615
  • 7
  • 28
  • 56
  • 1
    The difference between the data in your graph and the array `a` is stark. For the data in the graph. I would be inclined simply subtract the smoothed version from the data and threshold on statistically significant peaks using something like a median absolute deviation. – ebarr Feb 09 '16 at 01:55
  • similar question [here](https://stackoverflow.com/questions/31070563/find-all-local-maxima-and-minima-when-x-and-y-values-are-given-as-numpy-arrays?noredirect=1&lq=1) – Nathan majicvr.com Sep 26 '18 at 18:26
  • 1
    Does this answer your question? [Finding local maxima/minima with Numpy in a 1D numpy array](https://stackoverflow.com/questions/4624970/finding-local-maxima-minima-with-numpy-in-a-1d-numpy-array) – Mr. T Mar 09 '21 at 13:14

4 Answers4

31

There exists a bulit-in function argrelextrema that gets this task done:

import numpy as np
from scipy.signal import argrelextrema
    
a = np.array([1,2,3,4,5,4,3,2,1,2,3,2,1,2,3,4,5,6,5,4,3,2,1])

# determine the indices of the local maxima
max_ind = argrelextrema(a, np.greater)

# get the actual values using these indices
r = a[max_ind]  # array([5, 3, 6])

That gives you the desired output for r.

As of SciPy version 1.1, you can also use find_peaks. Below are two examples taken from the documentation itself.

Using the height argument, one can select all maxima above a certain threshold (in this example, all non-negative maxima; this can be very useful if one has to deal with a noisy baseline; if you want to find minima, just multiply you input by -1):

import matplotlib.pyplot as plt
from scipy.misc import electrocardiogram
from scipy.signal import find_peaks
import numpy as np

x = electrocardiogram()[2000:4000]
peaks, _ = find_peaks(x, height=0)
plt.plot(x)
plt.plot(peaks, x[peaks], "x")
plt.plot(np.zeros_like(x), "--", color="gray")
plt.show()

enter image description here

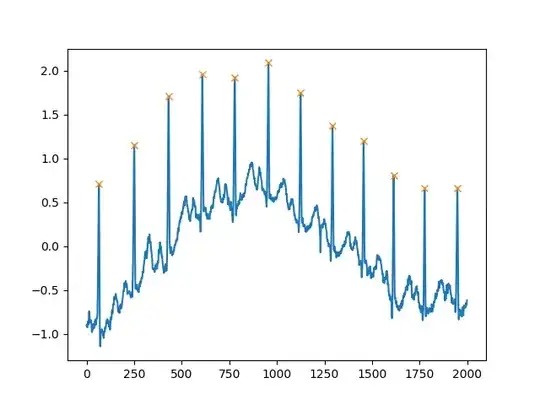
Another extremely helpful argument is distance, which defines the minimum distance between two peaks:

peaks, _ = find_peaks(x, distance=150)
# difference between peaks is >= 150
print(np.diff(peaks))
# prints [186 180 177 171 177 169 167 164 158 162 172]

plt.plot(x)
plt.plot(peaks, x[peaks], "x")
plt.show()
enter image description here

Cleb
  • 25,102
  • 20
  • 116
  • 151
  • 3
    @NathanThomas: Glad it helped! BTW: If you are interested in the minima you can replace `np.greater` by `np.less`. – Cleb Feb 09 '16 at 17:55
2

If your original data is noisy, then using statistical methods is preferable, as not all peaks are going to be significant. For your a array, a possible solution is to use double differentials:

peaks = a[1:-1][np.diff(np.diff(a)) < 0]
# peaks = array([5, 3, 6])
ebarr
  • 7,704
  • 1
  • 29
  • 40
  • I followed some advice from this post (http://stackoverflow.com/questions/25571260/scipy-signal-find-peaks-cwt-not-finding-the-peaks-accurately) to do a general gaussian filter which removed the noise. This data is from a spectrometer so Im trying to find the peak response over a bandwidth. I thought that the gaussian filter would give a good approximation of this (it doesn't need to be the exact peak) – GeoMonkey Feb 09 '16 at 01:59
  • ...are you looking for the peak of the red or the green lines in the graph above? – ebarr Feb 09 '16 at 02:15
  • Im looking for the peak of the red line. I should have made it more clear. Each peak is a bandwidth so I would like to get the greatest value for that band. – GeoMonkey Feb 09 '16 at 05:07
  • 2
    I think the code here should solve your problem: https://gist.github.com/endolith/250860 – ebarr Feb 09 '16 at 07:34
1
>> import numpy as np
>> from scipy.signal import argrelextrema
>> a = np.array([1,2,3,4,5,4,3,2,1,2,3,2,1,2,3,4,5,6,5,4,3,2,1])
>> argrelextrema(a, np.greater)
array([ 4, 10, 17]),)
>> a[argrelextrema(a, np.greater)]
array([5, 3, 6])

If your input represents a noisy distribution, you can try smoothing it with NumPy convolve function.

CodeCode
  • 41
  • 3
0

If you can exclude maxima at the edges of the arrays you can always check if one elements is bigger than each of it's neighbors by checking:

import numpy as np
array = np.array([1,2,3,4,5,4,3,2,1,2,3,2,1,2,3,4,5,6,5,4,3,2,1])
# Check that it is bigger than either of it's neighbors exluding edges:
max = (array[1:-1] > array[:-2]) & (array[1:-1] > array[2:])
# Print these values
print(array[1:-1][max])
# Locations of the maxima
print(np.arange(1, array.size-1)[max])
MSeifert
  • 145,886
  • 38
  • 333
  • 352