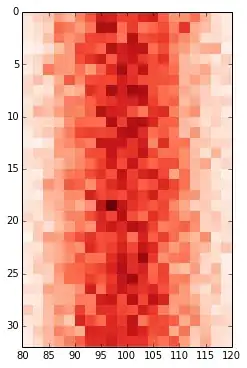
I'm trying to add a Colorbar to a spectrogram. I have tried every example and question thread I have found online and none have solved this issue
Note that 'spl1' (data splice 1) is a trace from ObsPy.
My code is:
fig = plt.figure()
ax1 = fig.add_axes([0.1, 0.75, 0.7, 0.2]) #[left bottom width height]
ax2 = fig.add_axes([0.1, 0.1, 0.7, 0.60], sharex=ax1)
ax3 = fig.add_axes([0.83, 0.1, 0.03, 0.6])

t = np.arange(spl1[0].stats.npts) / spl1[0].stats.sampling_rate
ax1.plot(t, spl1[0].data, 'k')

ax,spec = spectrogram(spl1[0].data,spl1[0].stats.sampling_rate, show=False, axes=ax2)
ax2.set_ylim(0.1, 15)
fig.colorbar(spec, cax=ax3)
It comes out with the error:
Traceback (most recent call last):

  File "<ipython-input-18-61226ccd2d85>", line 14, in <module>
    ax,spec = spectrogram(spl1[0].data,spl1[0].stats.sampling_rate, show=False, axes=ax2)

TypeError: 'Axes' object is not iterable
Best result so far:
Replacing the last 3 lines above with:
ax = spectrogram(spl1[0].data,spl1[0].stats.sampling_rate, show=False, axes=ax2)
ax2.set_ylim(0.1, 15)
fig.colorbar(ax,cax=ax3)
and this error for the colorbar:
axes object has no attribute 'autoscale_None'
I don't seem to be able to find a way to get the colorbar on the right to work.
Solutions?
One of the solutions I have seen is that you need to create an 'image' of your data using imshow(), however I don't get an output for that from Spectrogram(), only 'ax'. I have seen places try with the 'ax,spec' output from spectrogram() but that is causing the TypeError.
- Very similar code I found but didn't work https://www.nicotrebbin.de/wp-content/uploads/2012/03/bachelorthesis.pdf (ctrl+f 'colorbar')
- Looked at code examples from a related question
- imshow() suggestions and example - can't get an output from spectrogram to turn into an image. That second link, I also can't get the mlpy module to work (it doesn't think there's a mlpy.wavelet function)
- This problem was addressed in an improvement post for obspy but the solution he stated he found was not given
I hope someone can give a hand with this - I've been working on this all day now!

