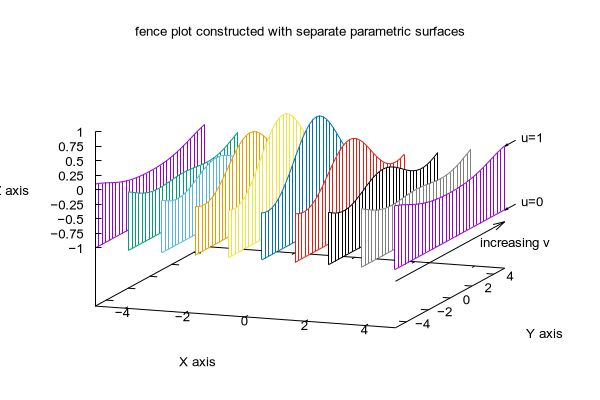
I'm looking for a way to plot histograms in 3d to produce something like this figure http://www.gnuplot.info/demo/surface1.17.png but where each series is a histogram.
I'm using the procedure given here https://stackoverflow.com/a/19596160 and http://www.gnuplotting.org/calculating-histograms/ to produce histograms, and it works perfectly in 2d. Basically, the commands I use are
hist = 'u (binwidth*(floor(($2-binstart)/binwidth)+0.5)+binstart):(1) smooth freq w boxes
plot 'data.txt' @hist
Now I would just like to add multiple histograms in the same plot, but because they overlap in 2d, I would like to space them out in a 3d plot.
I have tried to do the following command (using above procedure)
hist = 'u (1):(binwidth*(floor(($2-binstart)/binwidth)+0.5)+binstart):(1) smooth freq w boxes
splot 'data.txt' @hist
But gnuplot complains that the z values are undefined.
I don't understand why this would not put a histogram along the value 1 on the x-axis with the bins along the y-axis, and plot the height on the z-axis.
My data is formatted simply in two columns:
Index   angle
0       92.046
1       91.331
2       86.604
3       88.446
4       85.384
5       85.975
6       88.566
7       90.575
I have 10 files like this, and since the values in the files are close to each other, they will completely overlap if I plot them all in one 2d histogram. Therefore, I would like to see 10 histograms behind each other in a sort of 3d perspective.


