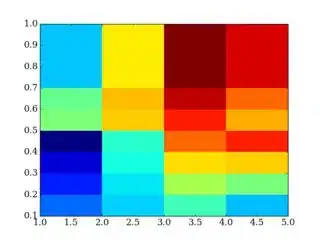
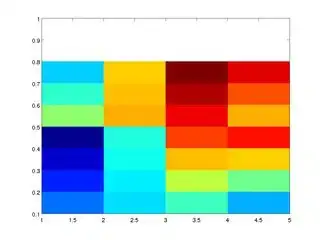
I have difficulty to interpolate a matrix/data frame in python.
Suppose we I have a matrix M = 3x4 and x = [1 3 5], y = [0.1 0.4 0.5 0.7]
This is my way to do interpolate and then plot in Matlab.
xq = 1:1:5;
yq = 0.1:0.1:1;
[xq,yq] = meshgrid(xq,yq);
zq = interp2(y,x,M,xq,yq);
figure
h=pcolor(xq,yq,zq)
set(h,'EdgeColor','none')
This is a possible way in Python
from scipy import interpolate
import numpy as np

def my_interp(X, Y, Z, x, y, spn=3):
    xs,ys = map(np.array,(x,y))
    z = np.zeros(xs.shape)
    for i,(x,y) in enumerate(zip(xs,ys)):
        # get the indices of the nearest x,y
        xi = np.argmin(np.abs(X[0,:]-x))
        yi = np.argmin(np.abs(Y[:,0]-y))
        xlo = max(xi-spn, 0)
        ylo = max(yi-spn, 0)
        xhi = min(xi+spn, X[0,:].size)
        yhi = min(yi+spn, Y[:,0].size)
        # make slices of X,Y,Z that are only a few items wide
        nX = X[xlo:xhi, ylo:yhi]
        nY = Y[xlo:xhi, ylo:yhi]
        nZ = Z[xlo:xhi, ylo:yhi]
        intp = interpolate.interp2d(nX, nY, nZ)
        z[i] = intp(x,y)[0]
    return z

zq = my_interp(y, x, M, xq, yq)

